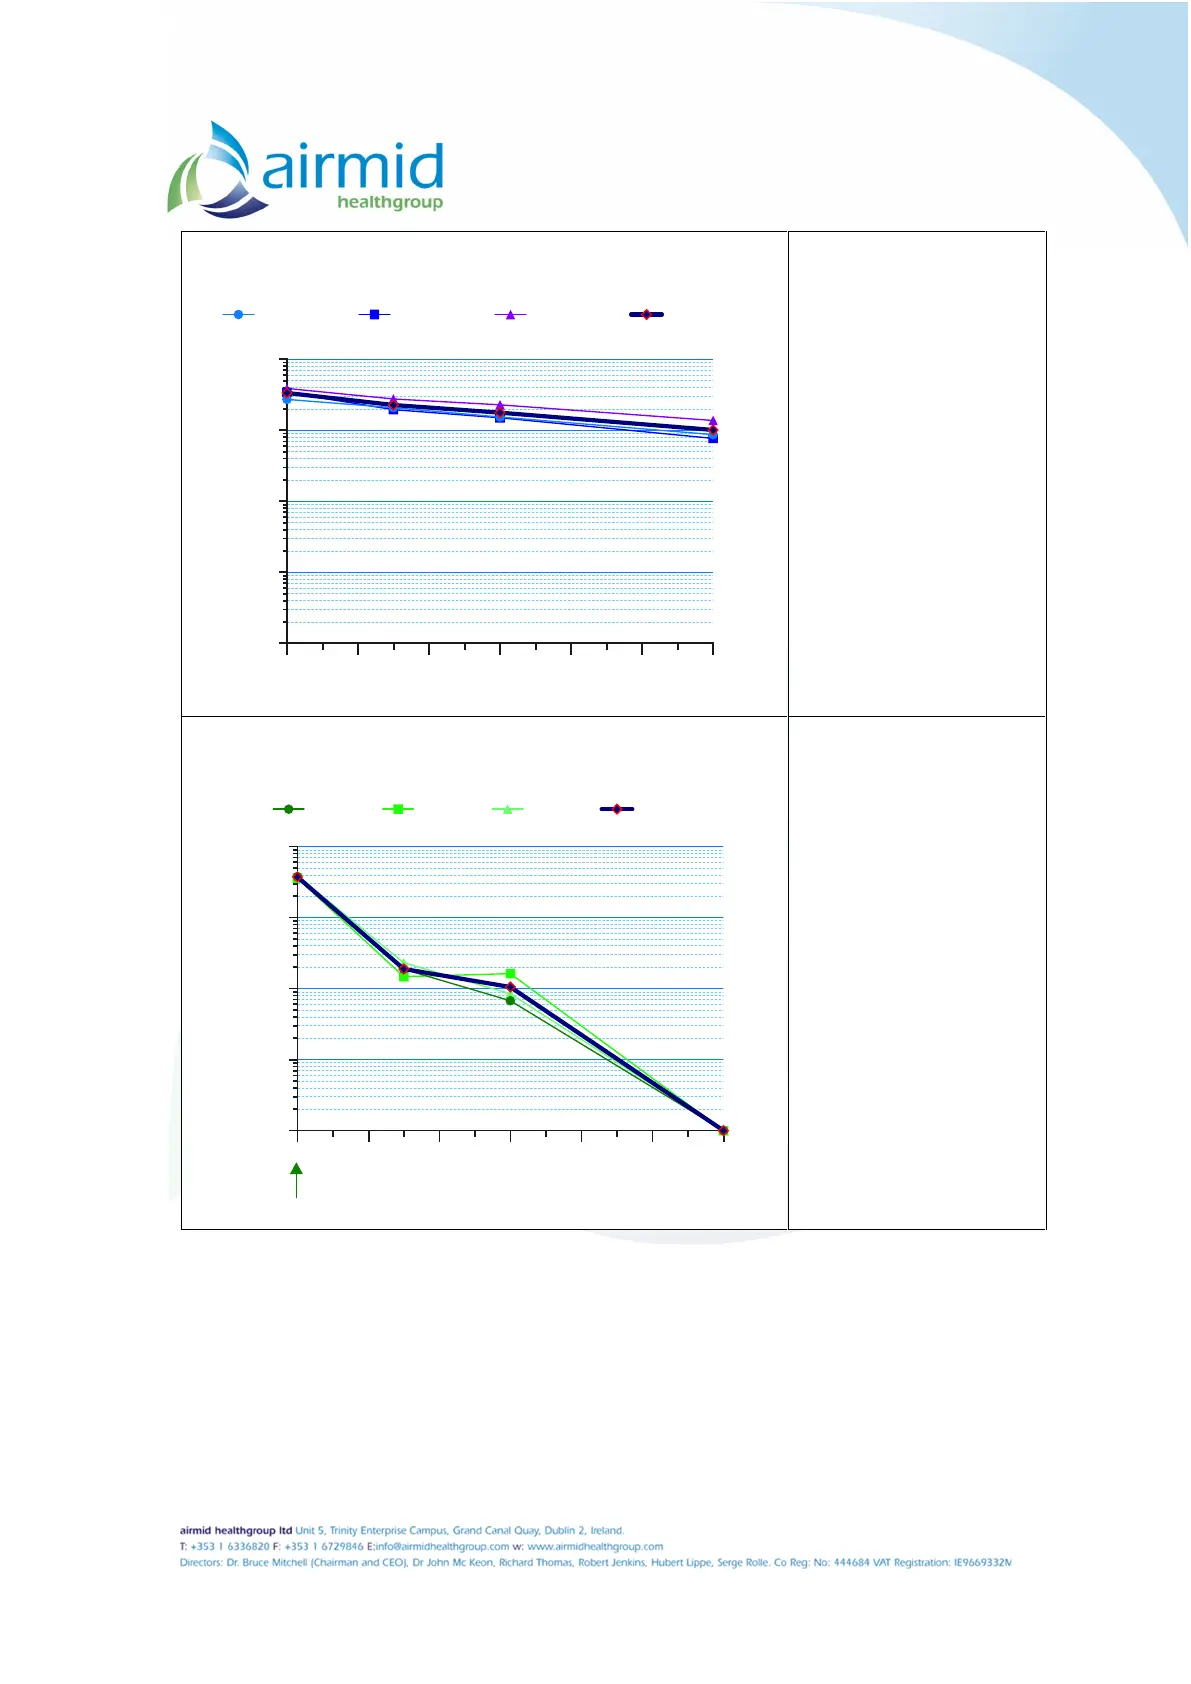
Figure 5.1
Influenza A concentration
(represented on a logarithmic
scale) in the test chamber
during inactive control runs
with no air purifier operating.
Each sampling point
represents the average of
three replicates.
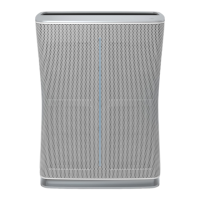
Figure 5.2
Influenza A concentration
(represented on a logarithmic
scale) in the test chamber
during active test runs
performed with the Roger
Little air purifier operating.
Each sampling point
represents the average of
three replicates.
The data presented here show that within the first 60 minutes of the Stadler Form Roger Little air
purifier operating at the highest fan speed, the Influenza A concentration in the test chamber was
reduced to less than 0.156 ng/ml (the detection limit of the assay performed to quantify the collected
airborne virus).
Figure 5.3 shows the percentage reduction in Inf A levels (calculated per the formula cited above
in Section 4.4) during the control and test runs. Fluctuations in virus concentration were observed
0 10 20 30 40 50 60
1
10
100
1000
10000
Time (minutes)
InfA Concentration (ng/m
3
)
Inactive Control Run
Control 1 Control 2 Control 3 Average
0 10 20 30 40 50 60
1
10
100
1000
10000
Time (minutes)
InfA Concentration (ng/m
3
)
Active Test Runs
Test 1
Device On
Test 2 Test 3
Average