4 54 5
Rev. 14.03.2019
USING THE DEVICE WITH A COMPUTER
1. INSTALLING SOFTWARE
Insert the CD into the CD drive.
The software will launch the installation le. To install the
software, follow the installation instructions.
If the software cannot run the installation le directly, open
the CD contents, then double-click on the.exe le icon (I.).
Follow the installation instructions.
2. SOFTWARE INTERFACE
2.1. MENU AND TOOLBAR
A. Opening les
B. Saving les
C. Settings
D. Setting time
E. Start real-time data logging
F. Stop real-time data logging
G. Connecting the meter with a computer
H. Disconnecting the meter from the
computer
I. Downloading data from the meter to the
computer
J. Printing
K. Help
2.2. SETTING TIME
This function is used to set the meter’s time according to
the computer’s time.
The date can be set in three formats: „YY-MM-DD“ (year-
month-day), „MM-DD-YY“ (month-day-year), „DD-MM-YY“
(day-month – year).
2.3. REAL
-
TIME DATA LOGGING
This function is used to monitor and create a linear graph
of ambient sounds in real time after connecting the meter
to the software.
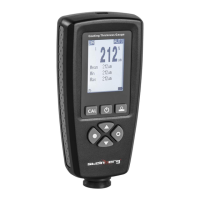
2.3.1. PANEL DESCRIPTION
1. Measurement start time
2. Measurement end time
3. Maximum reading recorded
4. Minimum reading recorded
5. File list
6. Name of record
7. Unit of measure
8. Number of readings recorded
9. Sampling frequency
10. Average value of data
11. Alarm upper limit
12. Alarm lower limit
2.3.2. A
-
B GRAPH DESCRIPTION
To look at a specic part of the graph of results, mark the
selected range using markers A and B.
To move the marker A, press the minus next to the marker
so that „A“ is highlighted in yellow.
Use the arrow (4 diamonds) to move the marker on the
graph to the desired position.
To zoom in on the graph, use the lens plus button.
EN
USER MANUAL
A B C D E F
G H I J K
1 3
2 4
7 9
11
6 8
10 12
5
 Loading...