101
7.7.3 PV Plant Information
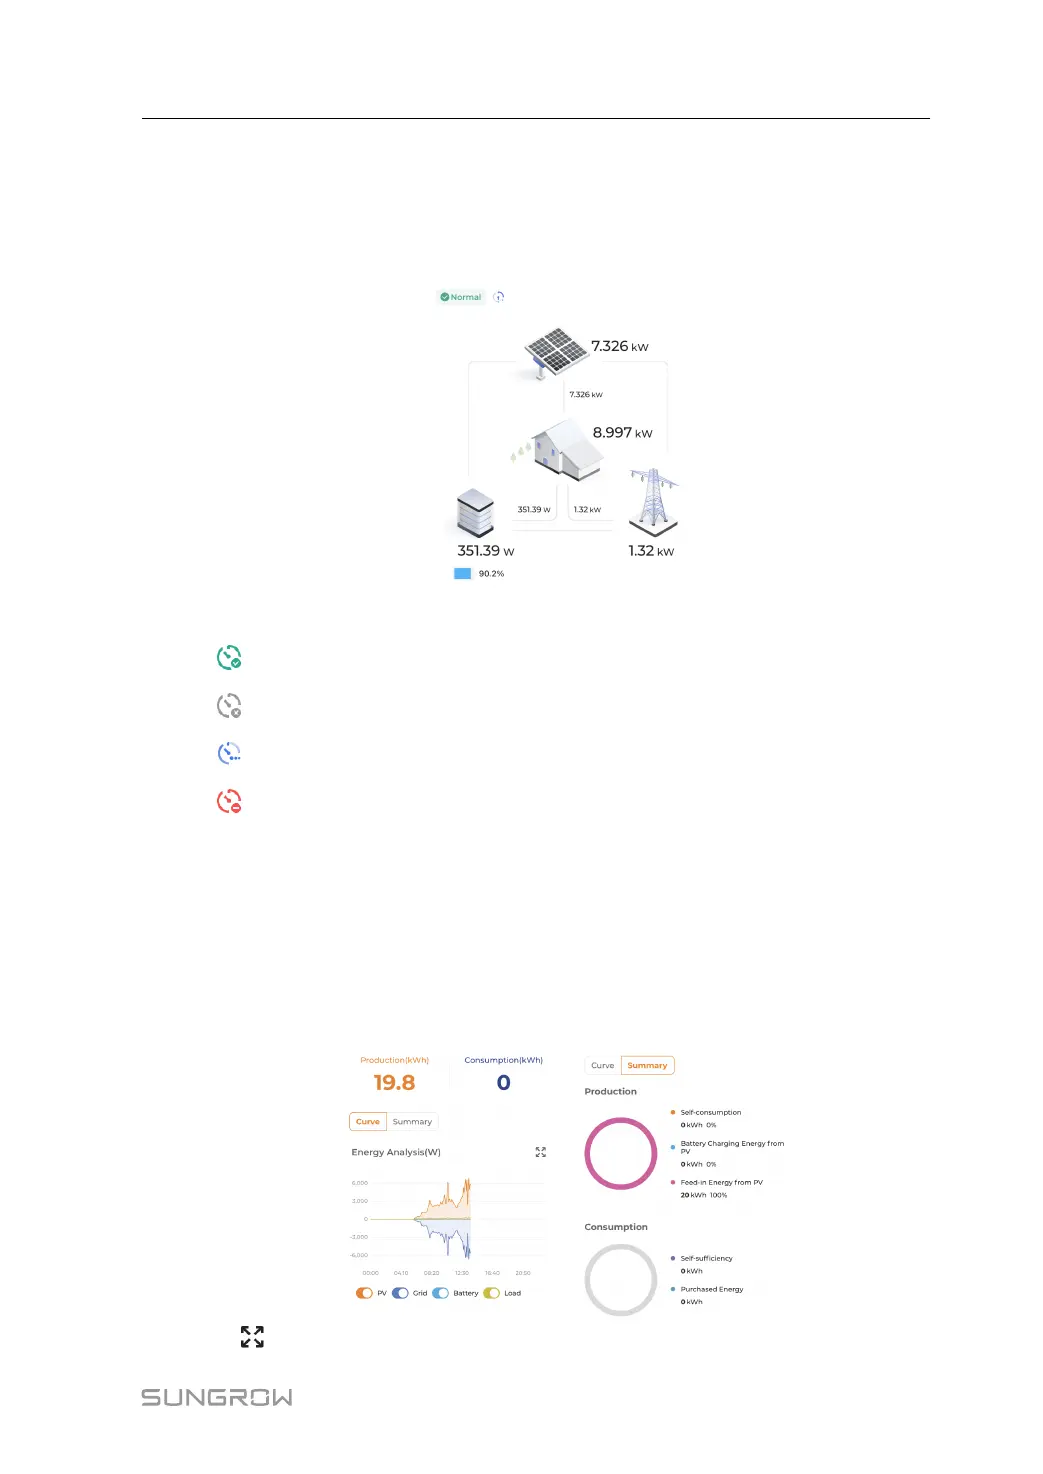
Power Flow: Information such as generated output and feed-in power of the PV system are
shown here. Arrows between the icons indicate that there is energy flowing between the
devices. The direction in which the arrow points indicates the direction of the energy flow.
Users granted access to live data can see the live data status:
Live data enabled
Live data not enabled
Enabling live data
The device does not support live data
The Owner can view operation information of the plant such as Today Yield and Today
Revenue.
The Distributor/Installer can view operation information of the plant such as Energy
Analysis, Production and Consumption of power, and Earning.
Take Energy Analysis as an example:
You can toggle between Curve and Summary to check the curves and the production and
consumption data.
Tap in the upper right corner of the curve graph to view it in landscape mode.
User Manual 7 iSolarCloud App
 Loading...