EN7
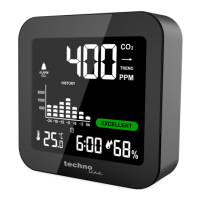
EXCELLENT: 400~600 ppm;
GOOD: 601 ~ 1000 ppm;
MEDIUM: 1001 ~ 1500 ppm;
POOR: 1501~2000 ppm;
POOR is flashing: 2001 ppm and above
CO2 concentration in 24 hour history display
CO2 concentration history is displayed by an 8 grid bar
graph, who changes accordingly to the measured CO2
value:
8 Grid: 3501 ~ 5000 ppm
7 Grid: 2001 ~ 3500 ppm
6 Grid: 1501 ~ 2000 ppm
5 Grid: 1001-1500 ppm
4 Grid: 801 ~ 1000 ppm
3 Grid: 601 ~ 800 ppm
2 Grid: 501 ~ 600 ppm
1 Grid: 400 ~ 500 ppm
The average CO2 concentration over 24 hours will be
briefly shown in a bar chart: -24h, -18h, -12h, -9h, -6h, -3h,
-0h.
Calibration of CO2: