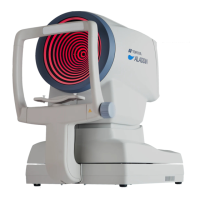
ALADDIN - User manual Rev. 19 EN of 10/07/2019
Table 1.
Agreement between ALADDIN HW3.0 and LENSTAR LS 900.
Note to the Table 1:
- data in table concern the summarized comparison produced by 3 operators using 3 different Aladdin and 3 different
Lenstar LS 900 units.
The results of the study demonstrate that the Axial Length (AL), Cylinder Axis (AX), Anterior Chamber Depth
(ACD), Lens Thickness (LT), Central Corneal Thickness (CCT), White-to-white distance (WTW) and Keratometry
(K1_D and K2_D) measurements of the ALADDIN HW3.0 are substantially equivalent to those of the predicate
device.
Analysis of Precision
The measurements for the Precision analysis arise from the first three acceptable measurement types
acquired from each device.
Analysis of precision, for each endpoint, will be performed on ALADDIN and LENSTAR separately using a REML
method for repeated measures within subject including the subsequent terms: device identifier (A1, A2, A3
for ALADDIN and L1, L2, L3 for LENSTAR), operator identifier (1, 2 and 3), subject identifier (1 to 66) and every
two-way interactions and the three-way interaction; a standard variance component matrix will be used as
covariance structure of R-side matrix. The related results will be used to estimate: - the repeatability SD as
the square root of model MSE; the repeatability limit as repeatability SD multiplied by 2.8; the repeatability
coefficient of variation as (repeatability SD / mean) multiplied 100; - the reproducibility SD as the square root
of (device variance component estimate + operator variance component estimate + device*subject variance
component estimate + operator*subject variance component estimate + device*operator variance
component estimate + device*operator*subject variance component estimate + model MSE); the
reproducibility limit as reproducibility SD multiplied by 2.8; the reproducibility coefficient of variation as
(reproducibility SD / mean) multiplied 100.
Variance component estimates were provided for every model term.
To assess if the variability of repeated measures within a subject is fairly constant across the range of results:
1) plot of the standard deviation of repeated results within eye (vertical axis) versus the mean of
repeated results (horizontal axis) was provided for each endpoint;

 Loading...