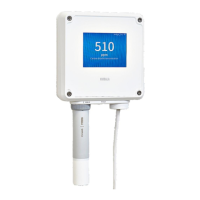
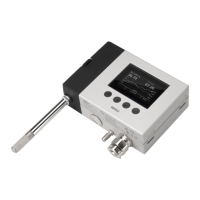
The Indigo display can be configured
to show 1-3 measurement parameters. Information
about the transmitter and connected probe (for example, notifications and warnings) is
shown on a message row at the bottom of the display. Relay and wireless access point
activity is also shown on the display.
The parameters shown on the display, display brightness and display mode (numeric or
graph) can be configured with the wireless configuration interface in the Se
ttings > General
menu.
2.5.1 Graph Display Mode
Figure 6 Indigo Display in Graph Mode
Y
ou can set the Indigo display to show the connected probe's measurement data as a graph.
The display mode can be changed in the wireless configuration interface's Se
ttings >
General menu.
More Information
‣
Display Settings (page 32)
Chapter 2 – Product Overview
11
 Loading...