The first figure is an example of a single filter response plot, while the second shows a
combined display of both spectra. The combined display makes it easy to compare the filter
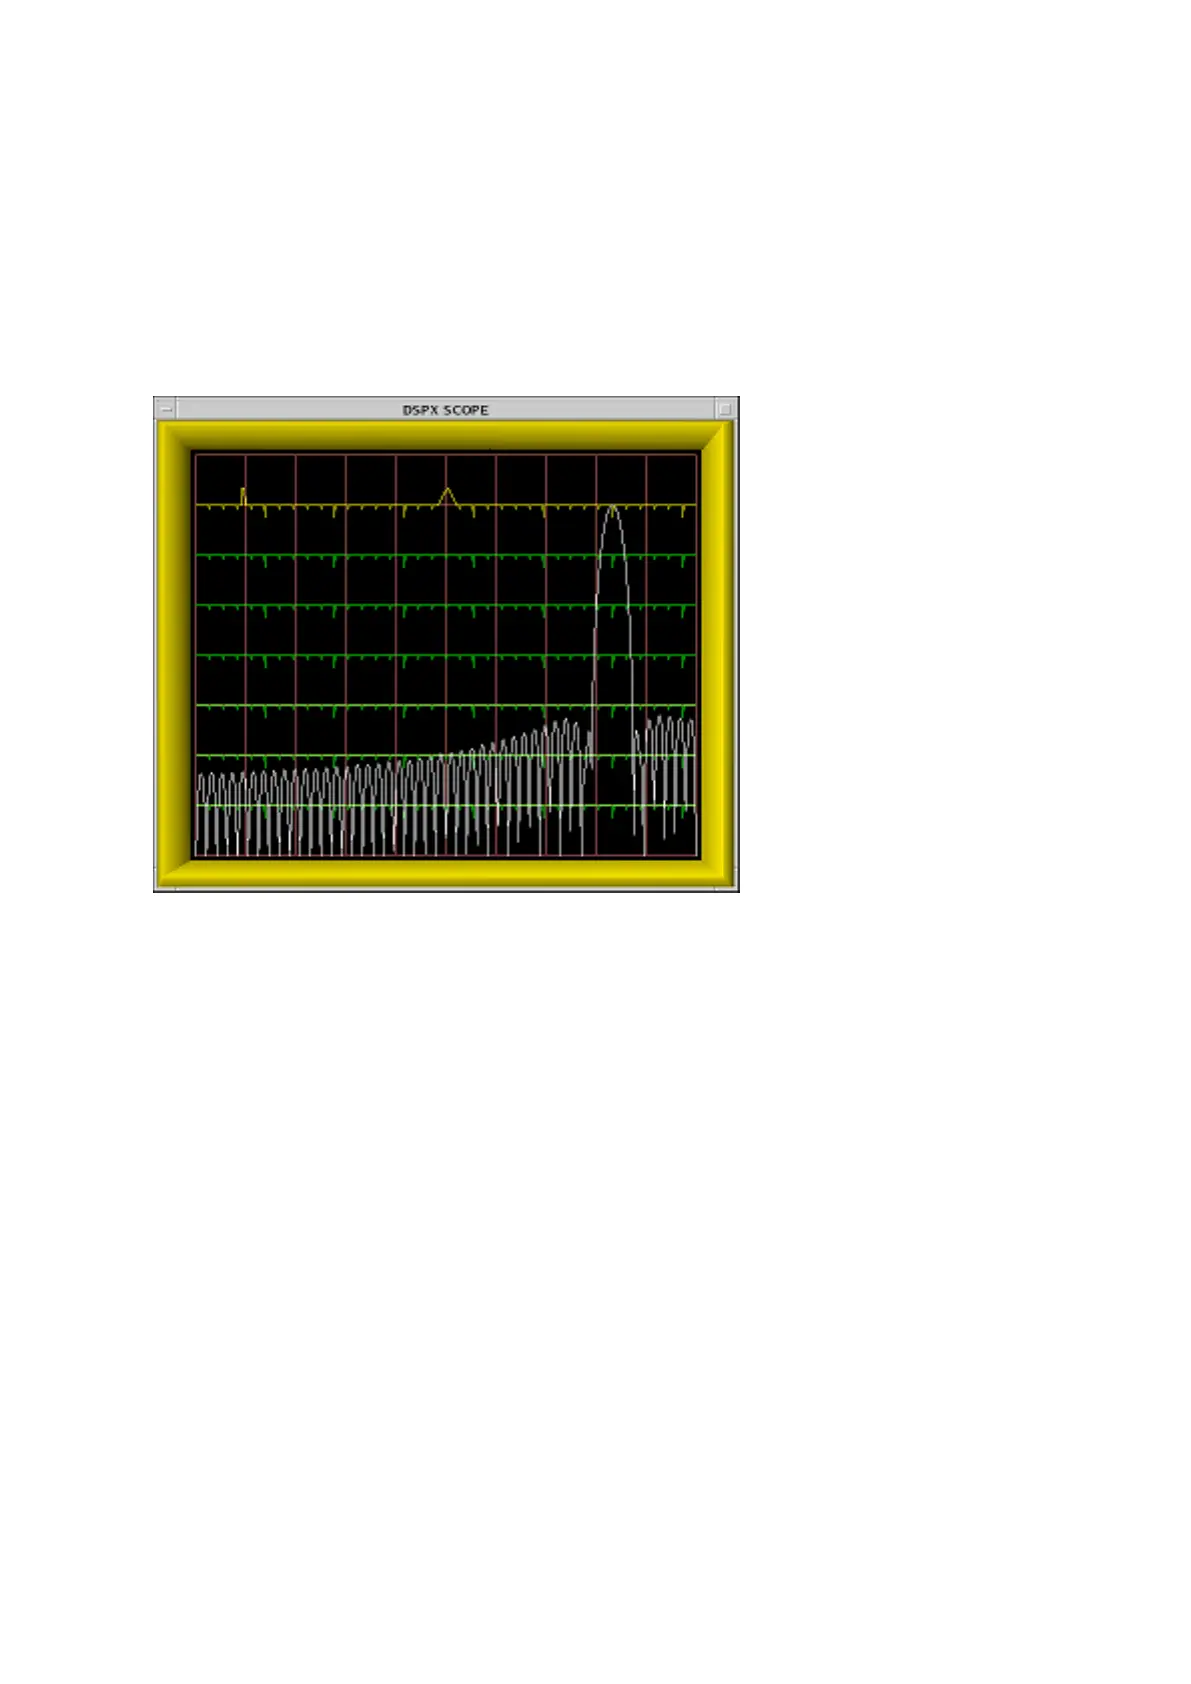
being designed with the live waveform that it is intended to selectively pass.
The filter's frequency response is always drawn with its passband peak touching the top of
the plot. The vertical height of the burst spectrum varies with signal strength but can be
adjusted using the Z subcommand.
Figure 26 Example of a Filter With Excellent DC Rejection
RVP900 User Guide M211322EN-J
138
 Loading...