This verifies that the analog waveform is generated properly checks that the matched
filtering on the RVP900/Rx card can deconvolve the compressed information.
1. Connect the Channel #1 or Channel #2 output of the RVP900/Tx card to the IF-Input of
the IFDR.
2. In the Mz menu, use the RVP900/Tx channel that has been configured for waveform
synthesis.
See 5.2.7 Mz — Transmissions and Modulations (page 126).
3. Set the zero
oset of the transmitter pulse in the Mt<n> menu to, for example, 50 μsec.
This shifts the waveform out in range so the Pr plot can show it.
See 5.2.6 Mt<n> — Triggers for Pulsewidth n (page 116).
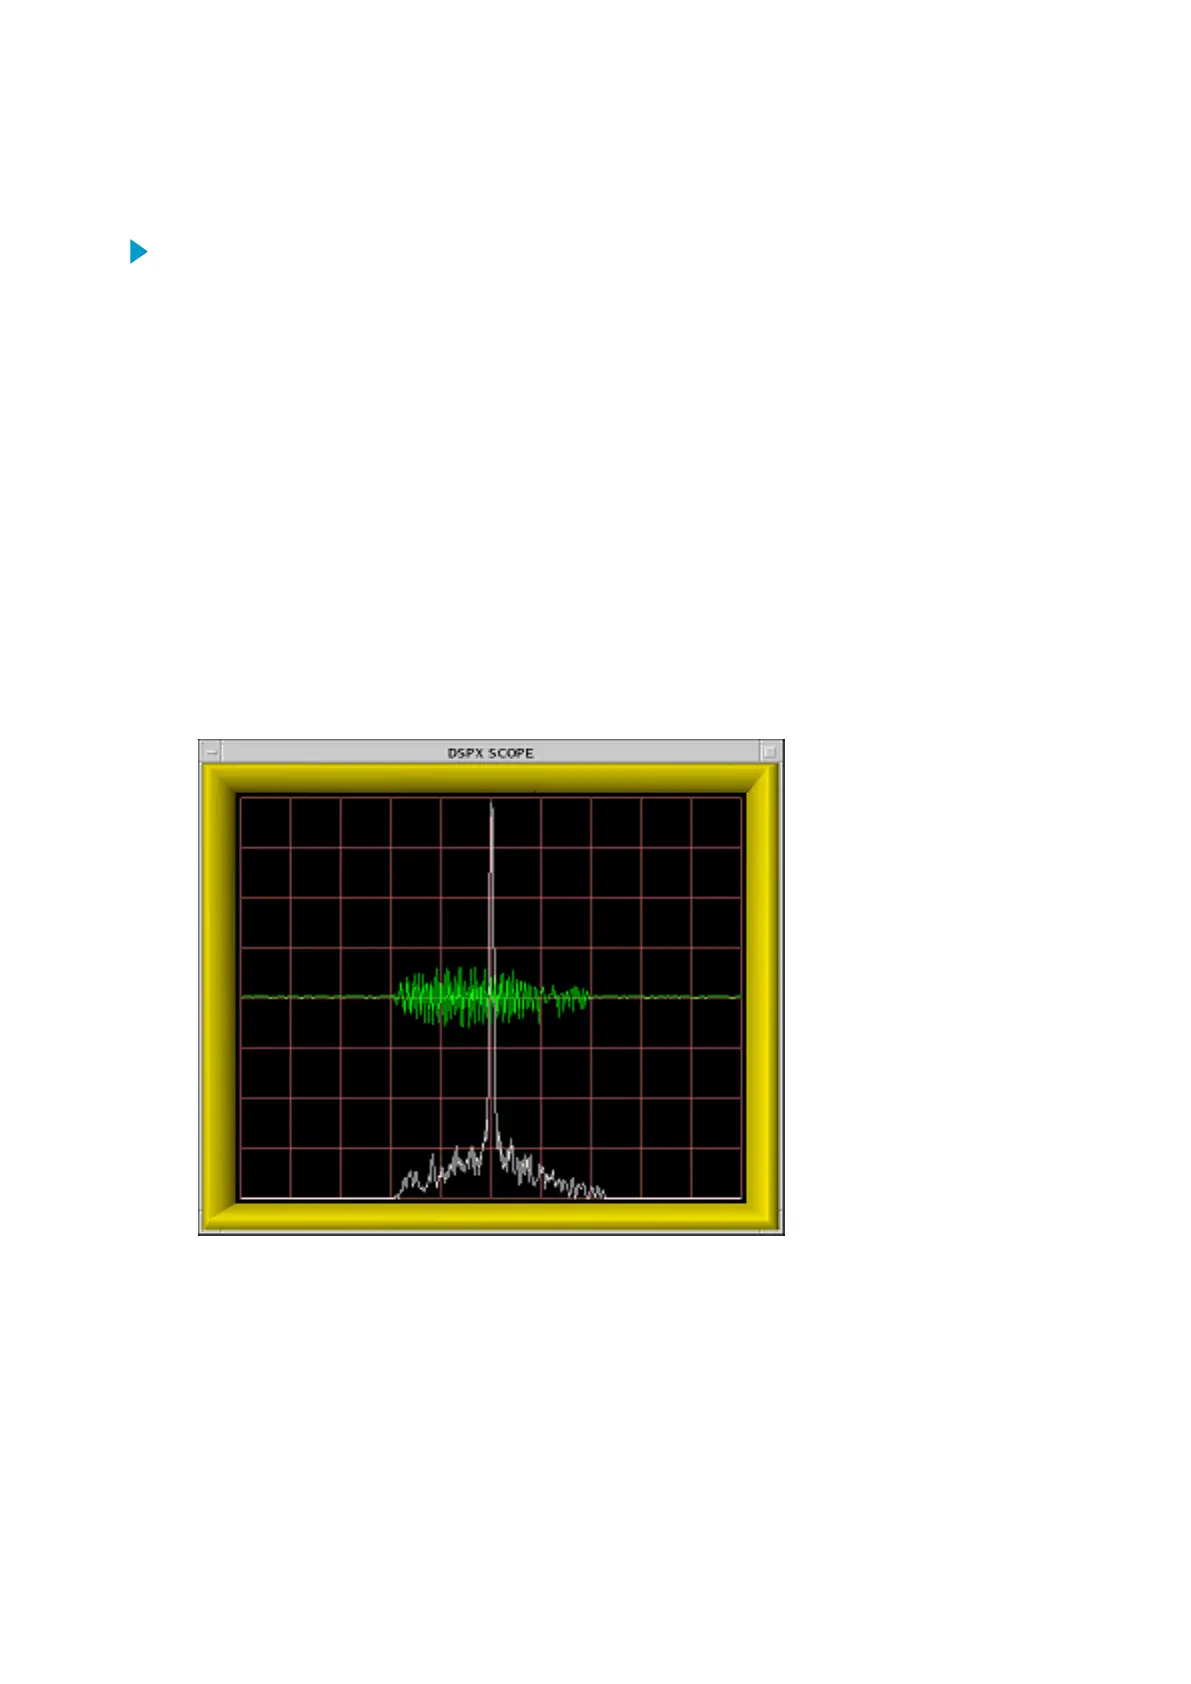
The following example shows a Pr plot of a 40 μsec, 5 MHz optimized waveform
generated by the RVP900/Tx card and fed into the IFDR.
In the example, the ideal Tx waveform has a Peak Sidelobe Level (PSL) of - 76.7dB and
an Integrated Sidelobe Level (ISL) of -62.3 dB. The measured testbench performance is
several dB short of this, probably because of the uncompensated analog band pass
filters on the RVP900/Tx and IFDR. These filters have several tenths of a dB of
amplitude ripple as well as minor deviations from linear phase within the 5 MHz signal
bandwidth.
The sampled analog waveform is not quite identical to the ideal waveform.
Figure 34 IFDR Sampling of Optimized Compressed Tx Waveform
RVP900 User Guide M211322EN-J
166
 Loading...