™
Page 9 of 59
2 vLoc3 Series Receivers
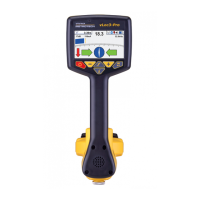
5. The receiver will scan all available frequencies and display a progress bar and the list of frequencies assessed will be
displayed. The frequency under test is shown on the top line.
Frequency: 8.19kHz
491Hz
512Hz
80 dB
74 dB
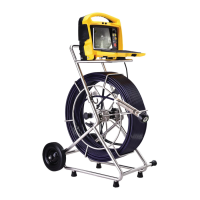
6. A numerical value ranging from 0dB to 140dB will be shown next to the frequency list with 140dB being the least possible
interference detected and 0db with the largest amount of possible interference.
7. The results are ranked from the least interference possible at the top to the largest amount of most possible interference at
the bottom.
8. In this case, the higher the dB number (80dB), the less interference has been detected by the receiver.
Frequency: 491Hz
491Hz
512Hz
8.19kHz
32.8kHz
65.5kHz
131kHz
200kHz
80 dB
74 dB
62 dB
56 dB
49 dB
43 dB
37 dB
NOTE
Although frequency results appear to have less interference, it still does not make it the best choice
to locate certain utilities. These include but are not limited to a conductor, current output, resistance,
and signal bleed over adjacent utilities.
2.7 vLoc3 Series Locate Modes and Screens
Note - The vLoc3 series user interface is under continual development. The screenshots described here may dier slightly from
your screens.
The vLoc3 series receivers give the user a choice of locating screens.
The choice of the screen depends on the application and user preference. These screens are:
- Classic Locate - Sonde Location - Transverse Locate
- Plan View Locate - Vector Locate
First we will explain the functions of the “Classic Screen,” as familiarity with this screen will help understand others' functions.
 Loading...