Switching Operation Screens
4-45
IM 04L42B01-01E
4
4.11 DisplayingStackedBarGraphs(/M1and/PM1
options;releasenumber3orlater)
This section explains how to use stacked bar graphs.
Procedure
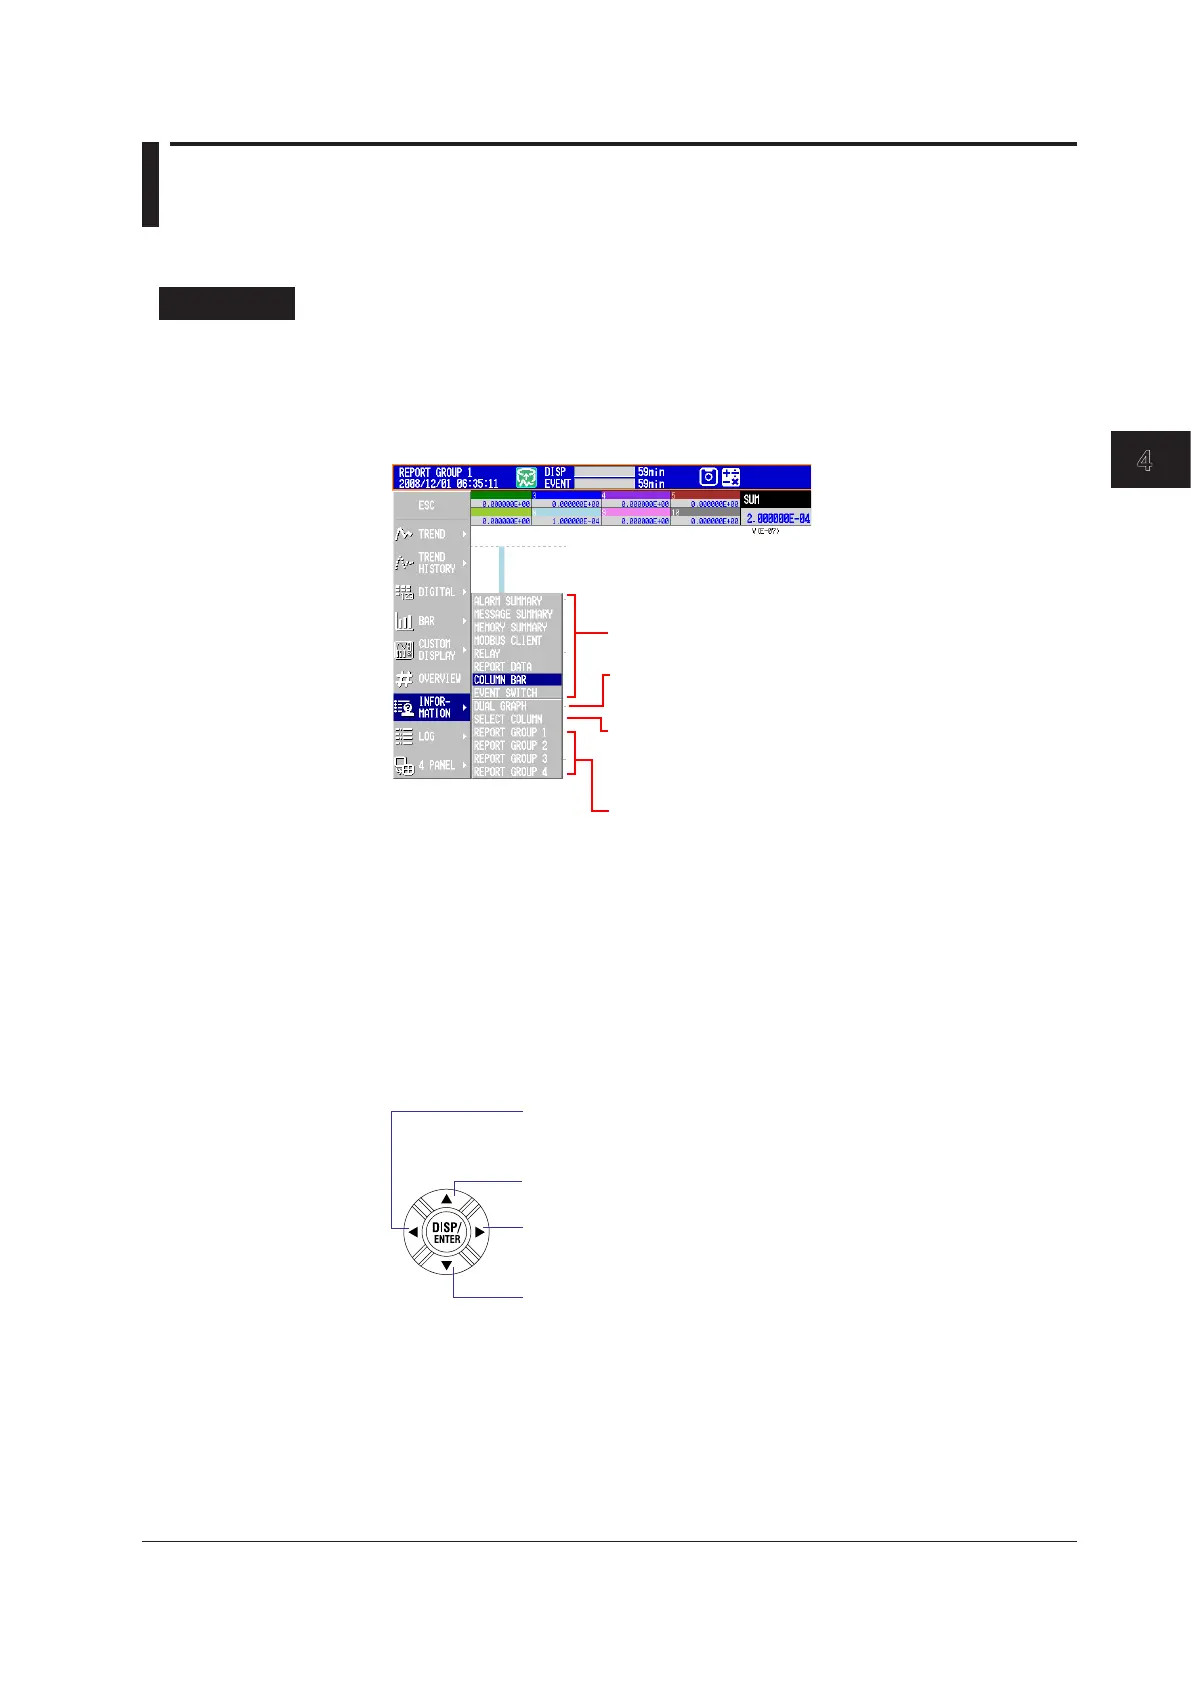
• ChangingtheDisplayedContents
1.
Press DISP/ENTER to show the display selection menu.
2.
Press the rightarrowkey to display the submenu.
3.
Press the upanddownarrowkeys to select the sub menu item.
REPORT GROUP 1 through 6
*
:
Select the report group that you
want to display.
* Varies according to the model.
For information about report groups, see section 9.5.
SELECT GROUP: Use the arrow keys to switch
between displayed report groups.
SELECT COLUMN: Use the arrow keys to select a bar
graph.
SINGLE GRAPH: Displays a single graph
DUAL GRAPH: Displays two graphs
Display name: Switches to the specified display
4.
Press DISP/ENTER to change the display setting.
To close the menu without changing the display contents, press ESC.
• ChangingGroups,SelectingBarGraphs,andMovingtheCursor
The amount of data that the up and down arrow keys scroll through depends on the
type of report data. For example, with an “H+D” report, you can use the arrows to
scroll through the data one day at a time.
SELECT GROUP: Switches to the display for the report group with
the next smallest number
SELECT COLUMN: Moves the bar graph selection cursor to the left
Switches to the previous day, week, or month’s data
SELECT GROUP: Switches to the display for the report group with
the next highest number
SELECT COLUMN: Moves the bar graph selection cursor to the right
Switches to the next day, week, or month’s data
 Loading...