For technical questions, please call 1-888-866-579742
About the Scan Tool
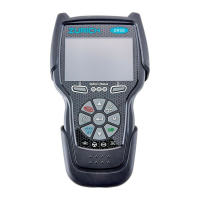
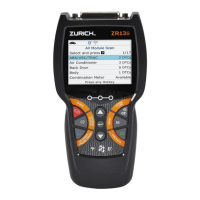
DISPLAY FUNCTIONS
3
5. M (Menu) button – When pressed, displays the Main Menu.
6. LD button – When pressed while linked to a vehicle, places the
Scan Tool in Live Data mode.
7. UP button – When in MENU mode, scrolls UP through the
menu options. When LINKED to a vehicle, scrolls UP through the
current display screen to display any additional data.
8. ENTER button - When in Menu mode, confirms the selected
option or value.
9. DOWN button - When in MENU mode, scrolls down through the
menu options.
When LINKED to a vehicle, scrolls down through the
current display screen to display any additional data.
10. GREEN LED - Indicates that all engine systems are running
normally (all Monitors on the vehicle are active and performing
their
diag
nostic testing, and no DTCs
are present).
11. YELLOW LED - Indicates there is a possible problem. A “Pending”
DTC is present and/or some of the vehicle's emission monitors have
not run their diagnostic testin
g.
12. RED LED - Indicates there is a problem in one or more of the
vehicle's systems. The red LED is also used to show that DTC(s)
are present. DTCs are shown on the Scan Tool’s LCD display. In
this case, the Malfunction Indicator (“Check Engine”) lamp
on the
vehicle's instrument panel will light steady on.
13. Display - Displays test results, Scan Tool functions and Monitor status
information. See DISPLAY FUNCTIONS, below, for details.
14. CABLE - Connects the Scan Tool to the vehicle's Data Link Connecto
r
(DLC).
DISPLAY FUNCTIONS
Figure 2. Display Functions
See Figure 2 for the locations of items 1 through 15, below.
1. I/M MONITOR STATUS field - Identifies the I/M Monitor status area.
4
3
2
5
7
6
114
10
11
12
8
9
13
15
VIEWING FIRMWARE VERSION
Additional Tests
THE TOOL LIBRARY
42
2. Select Vehicle Information, then press
ENTER
.
The Vehicle Information menu
displays.
3. Select Available Modules, then press
ENTER
.
4. When the retrieval process is completed,
a complete list of modules supported by
the vehicle under test displays.
5. When you have finished viewing the list of available modules, press
M
to return to the Main Menu.
Viewing In-use Performance Tracking (IPT)
The Scan Tool can retrieve In-use Performance Tracking (IPT) statistics
for monitors supported by the vehicle under test. Two values are
returned for each monitor; the number of times that all conditions
necessary for a specific monitor to detect a malfunction have been
encountered (XXXCOND), and the number of times that the vehicle has
been operated under the specific conditions for the monitor (XXXCOMP).
Statistics are also provided for the number of times the vehicle has been
operated in OBD monitoring conditions (OBDCOND), and the number of
times the vehicle’s engine has been started (IGNCNTR).
1. With the Scan Tool in OBD2 mode, press and release the M button.
The Main Menu displays.
2. Select Vehicle Information, then press the ENTER
button.
The Vehicle Information menu displays.
3. Select IPT, then press ENTER
.
4. When the retrieval process is completed,
the In-use Performance Tracking statistics
for the vehicle under test display.
If In-use Performance Tracking is
not available for your vehicle, an
advisory message shows on the
Scan Tool’s display. Press M to
return to the Main Menu.
5. When you have finished viewing the statistics, press M to return to
the Main Menu.
VIEWING THE FIRMWARE VERSION
1. Select Firmware Version in the Main
Menu, then press ENTER
.
 Loading...