-
29 -
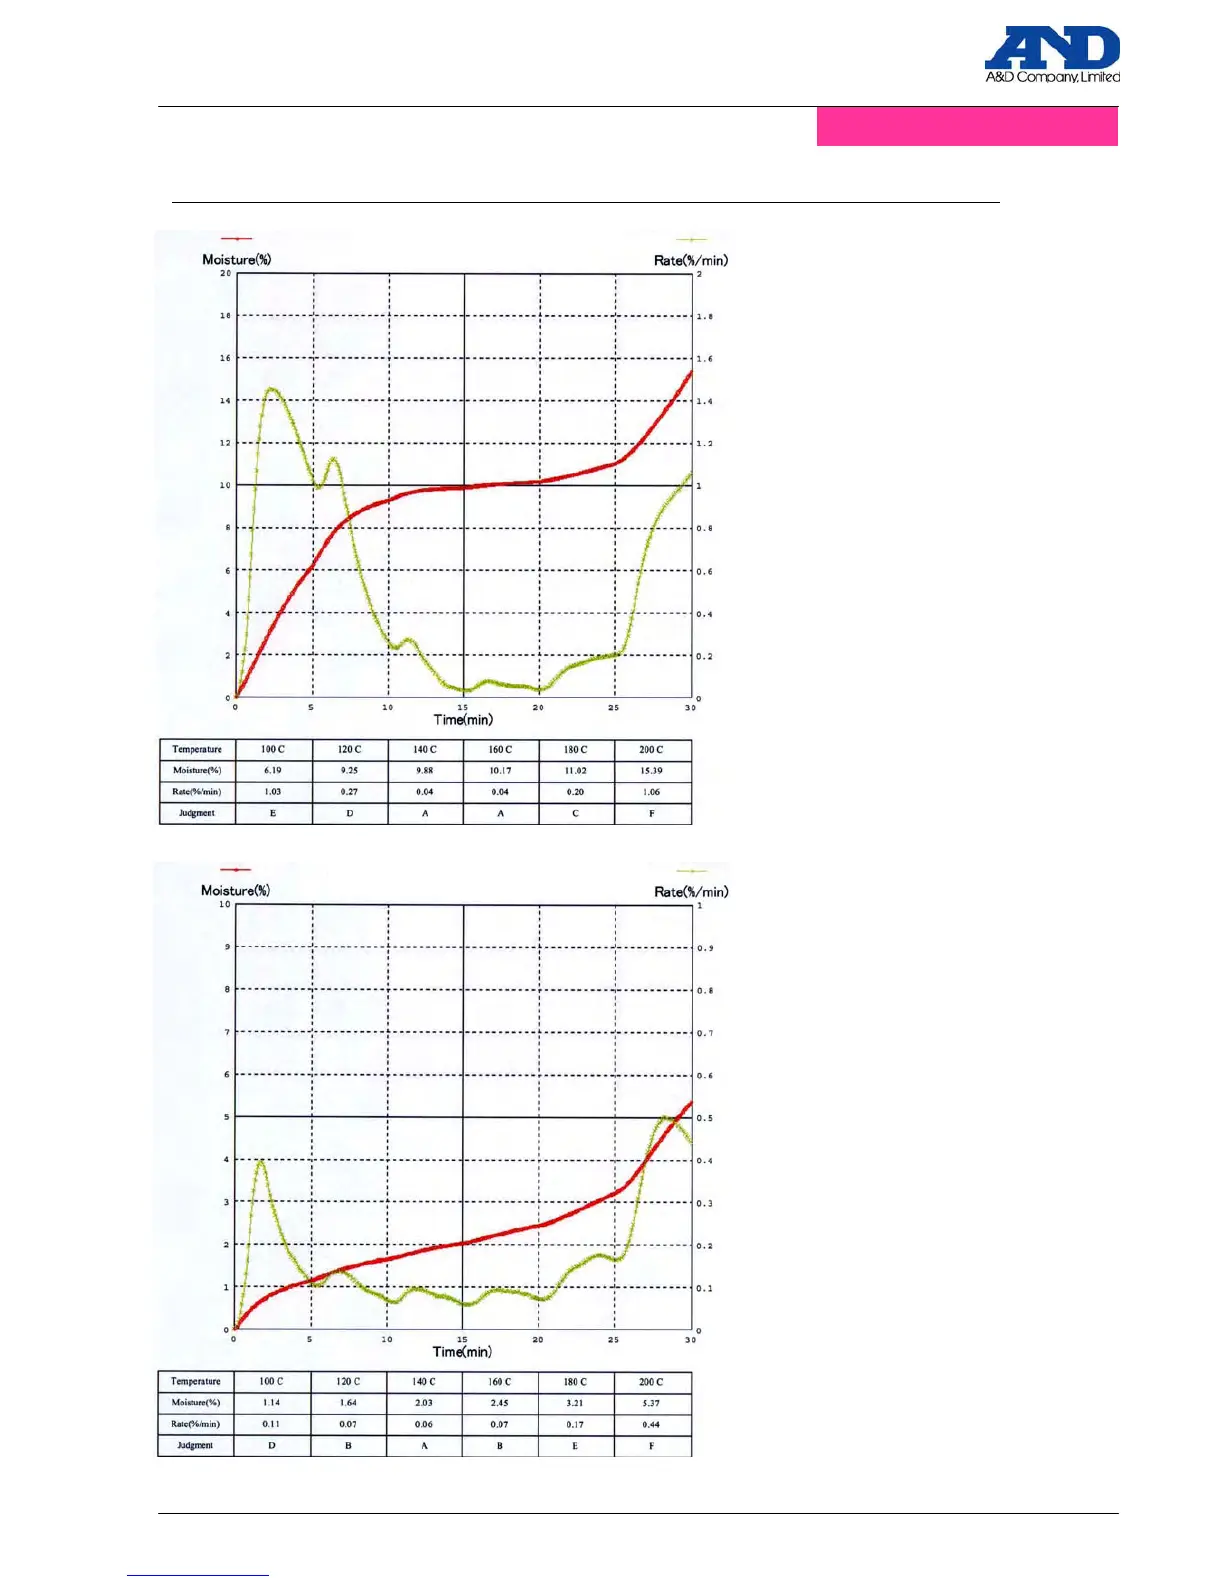
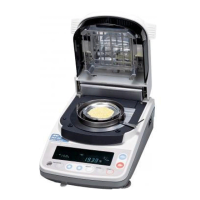
Example 2. The moisture content curve inclines sharply above a particular heating temperature
The upper and lower graphs display
measurement results for soy powde
and butter peanuts.
Rate (%/min.) increases shortly afte
the start of heating, then decreases,
and then increases again.
The Rate likely increased above
180℃ due to an component othe
than water (other liquids, additives,
organic matter) vaporizing, o
because the sample started to
carbonize.
In such cases, an excessively high
temperature could lead to lack o
reliability, repeatability and accuracy
in measurement values.
It is recommended that such samples
be measured at a temperature where
moisture content is stable and before
curves rapidly change.
Soy Bean Flour (MX-50, 5 g)
Butter Peanuts (MX-50, 5g)
■Application/B.Data analysis/2. RsFig