19
l/h
20
30
40
50
60
100
200
300
400
500
600
700
800
900
1000
1100
1000 2000 3000 4000 5000 6000 7000 8000 9000 10000
W
1
10
kPa 100
100 1100 l/h
FCW 31
FCW 21
FCW 41
500
1000
750
Water flow rate [l/h]
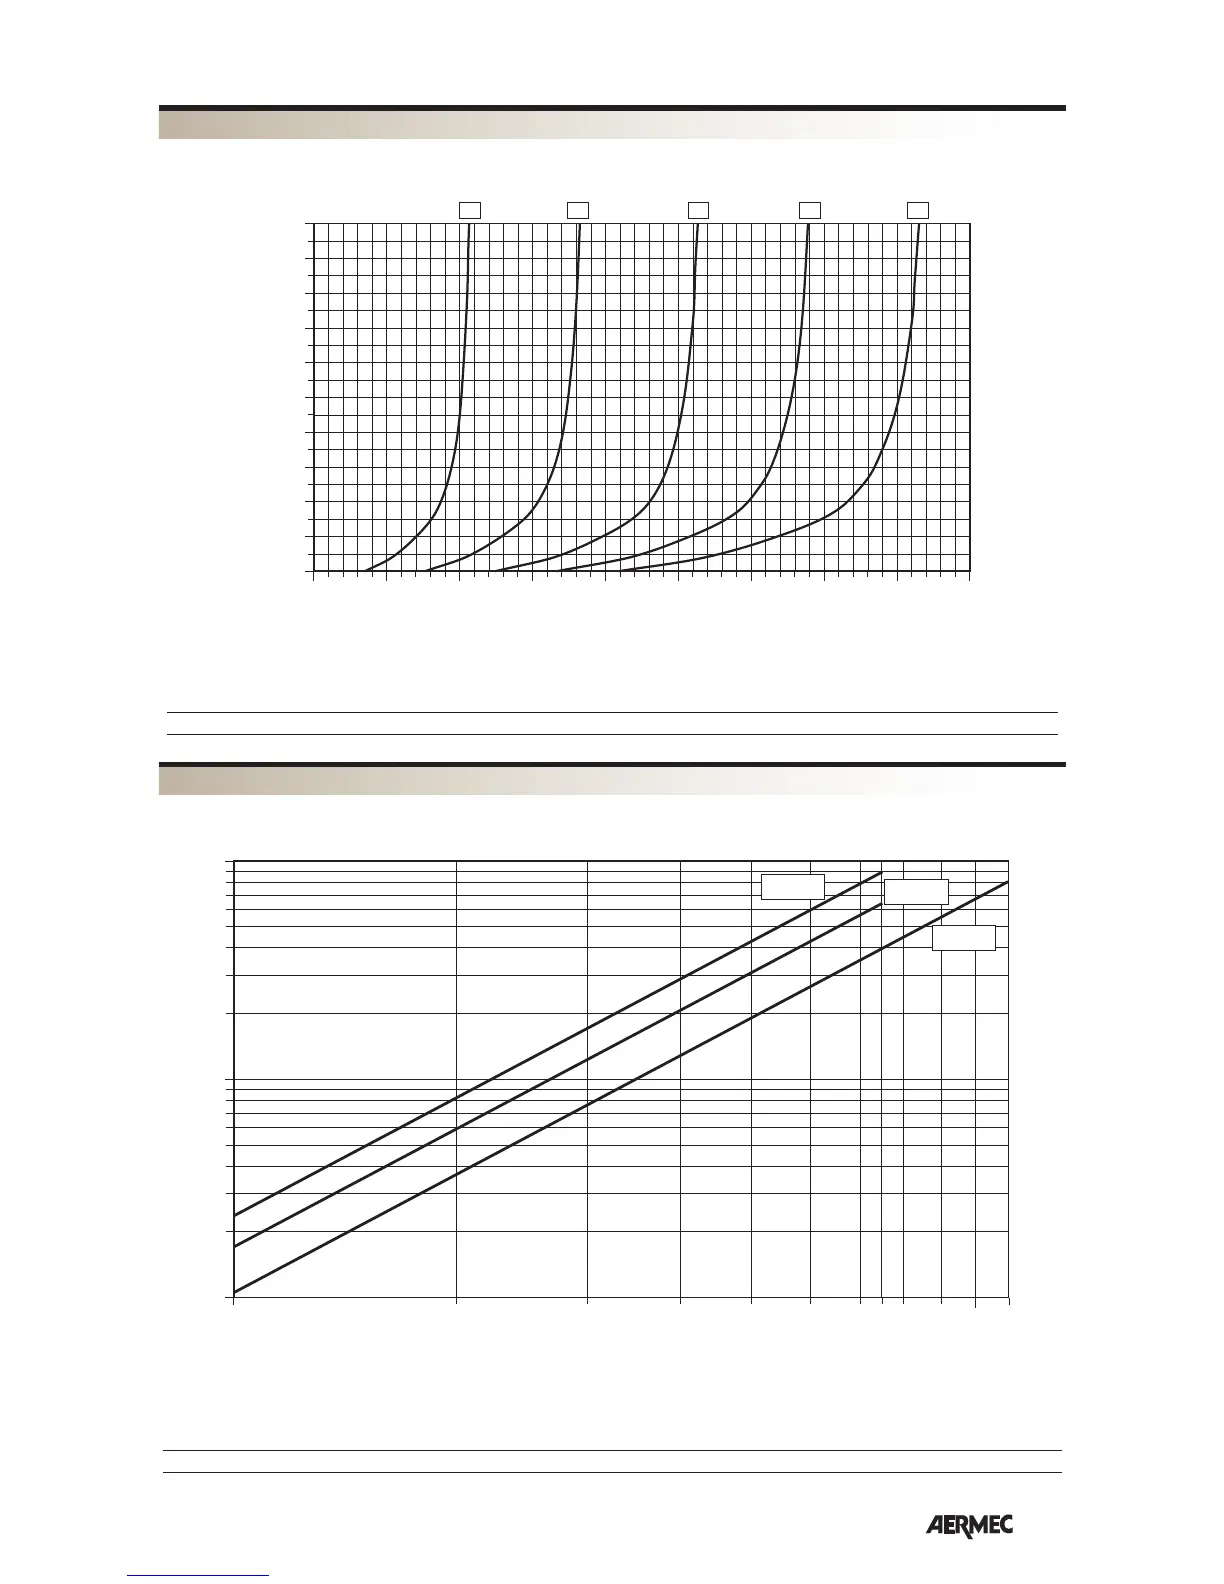
The pressure drops in the diagram refer to the average water temperature of 10 °C. The following table shows the correction
to apply to the pressure drops when the medium water temperature varies.
Medium water temperature °C 5 10 15 20 50 60 70
Multiplicational coefficient 1,03 1 0,96 0,91 0,78 0,75 0,72
Pressure drops (kPa)
TAV. 7
COIL PRESSURE DROPS
Heating capacity figures refer to maximum fan speed. Performance for other fan speeds can be obtained by multiplying
these figures by the following correction factors:
MOD. FCW 41 Medium speed Minimum speed
0,75 0,90
∆t °C (water inlet temperature- air inlet temperature)
Heating capacity [W]
TAV. 6 FCW 41
HEATING CAPACITY
Water flow rate [l/h]