072-0500 Alphasense User Manual
OPC-R1 Optical Particle Counter Issue 1
Alphasense Ltd Page 11 of 33 February 2019
Sensor Technology House, 300 Avenue West, Skyline 120, Great Notley. Essex.CM77 7AA. UK
Tel: +44 (0) 1376 556700 - Fax: +44 (0) 1376 335899
Email: sensors@alphasense.com - Web: www.alphasense.com
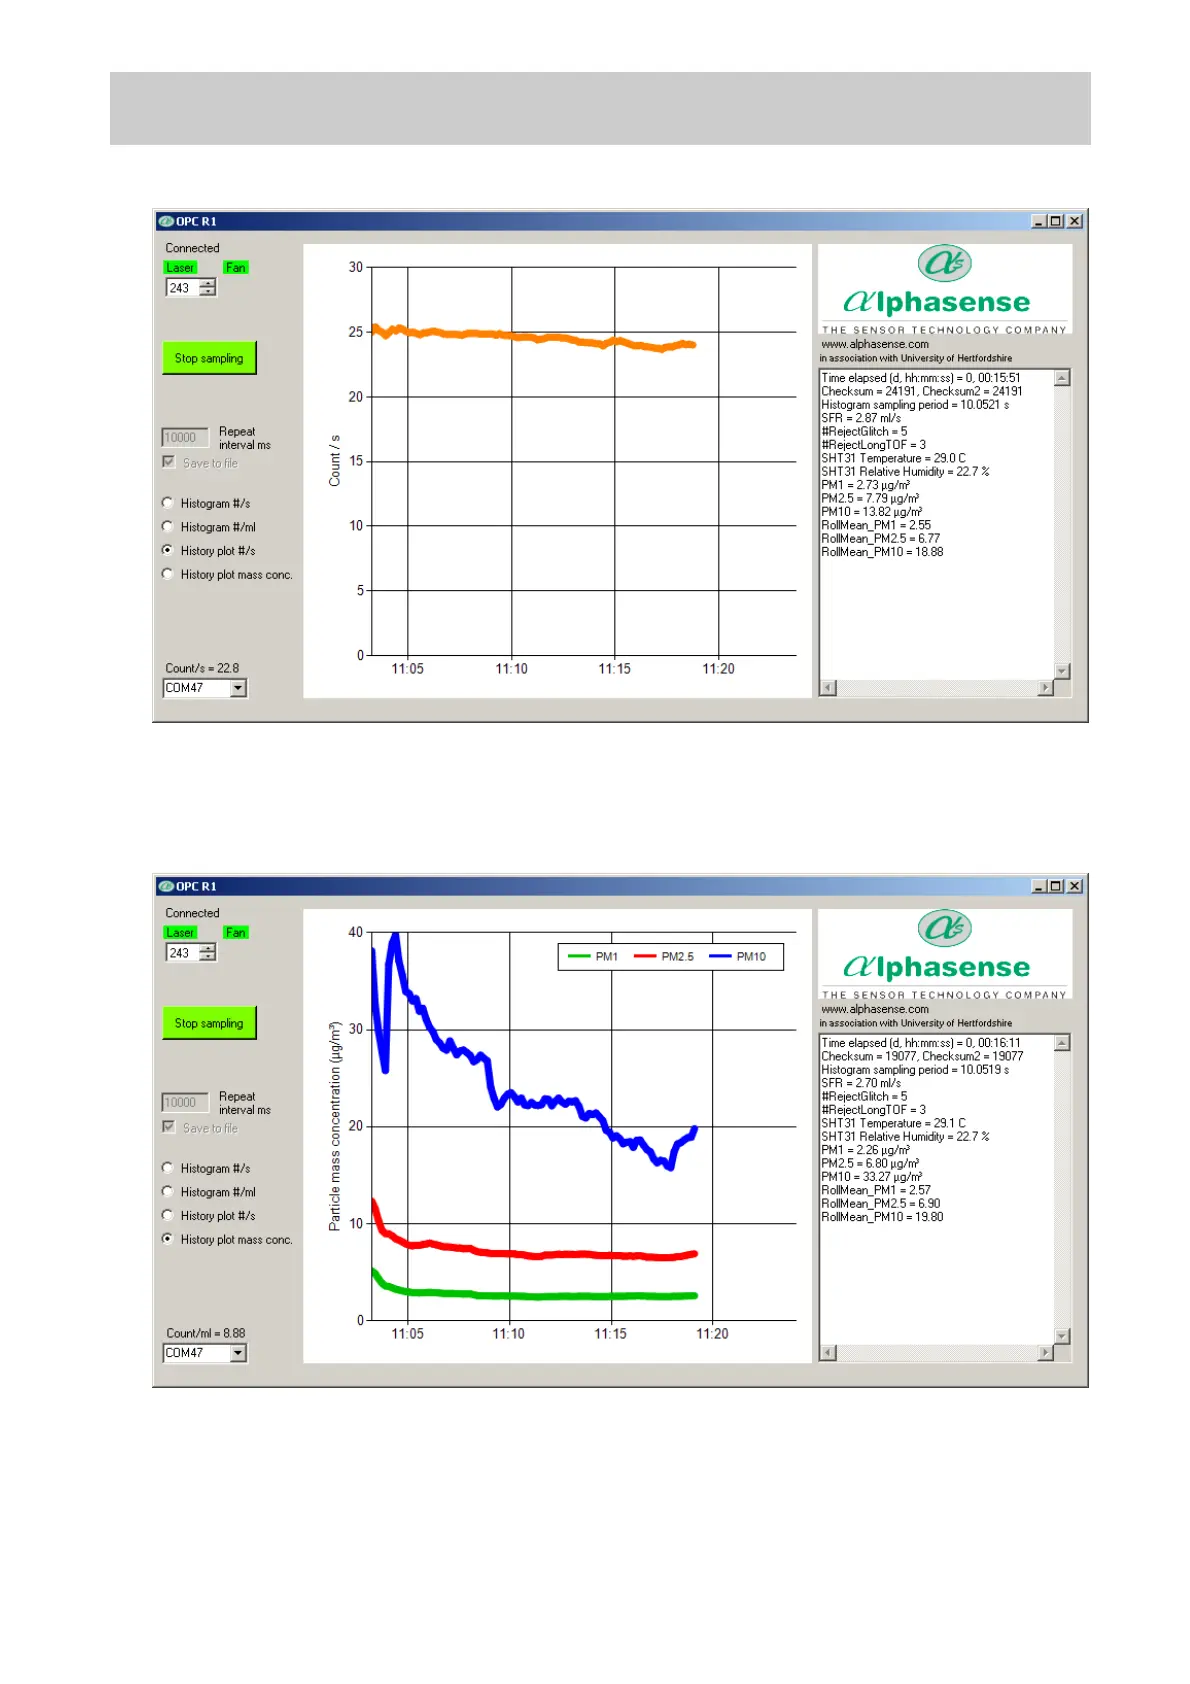
History Plot of Mass Concentration display mode
Click the ‘Histogram plot mass conc.’ Button on the left-hand side of the screen to show a temporal
record of PM
1
, PM
2.5
and PM
10
values (in µg/m
3
) since the start of the sampling session. The plot
scale will automatically change to show longer recording time periods and/or increasing PM values.
Data relating to each acquired histogram, including PM values, is given in the right-hand window
of the display.
 Loading...