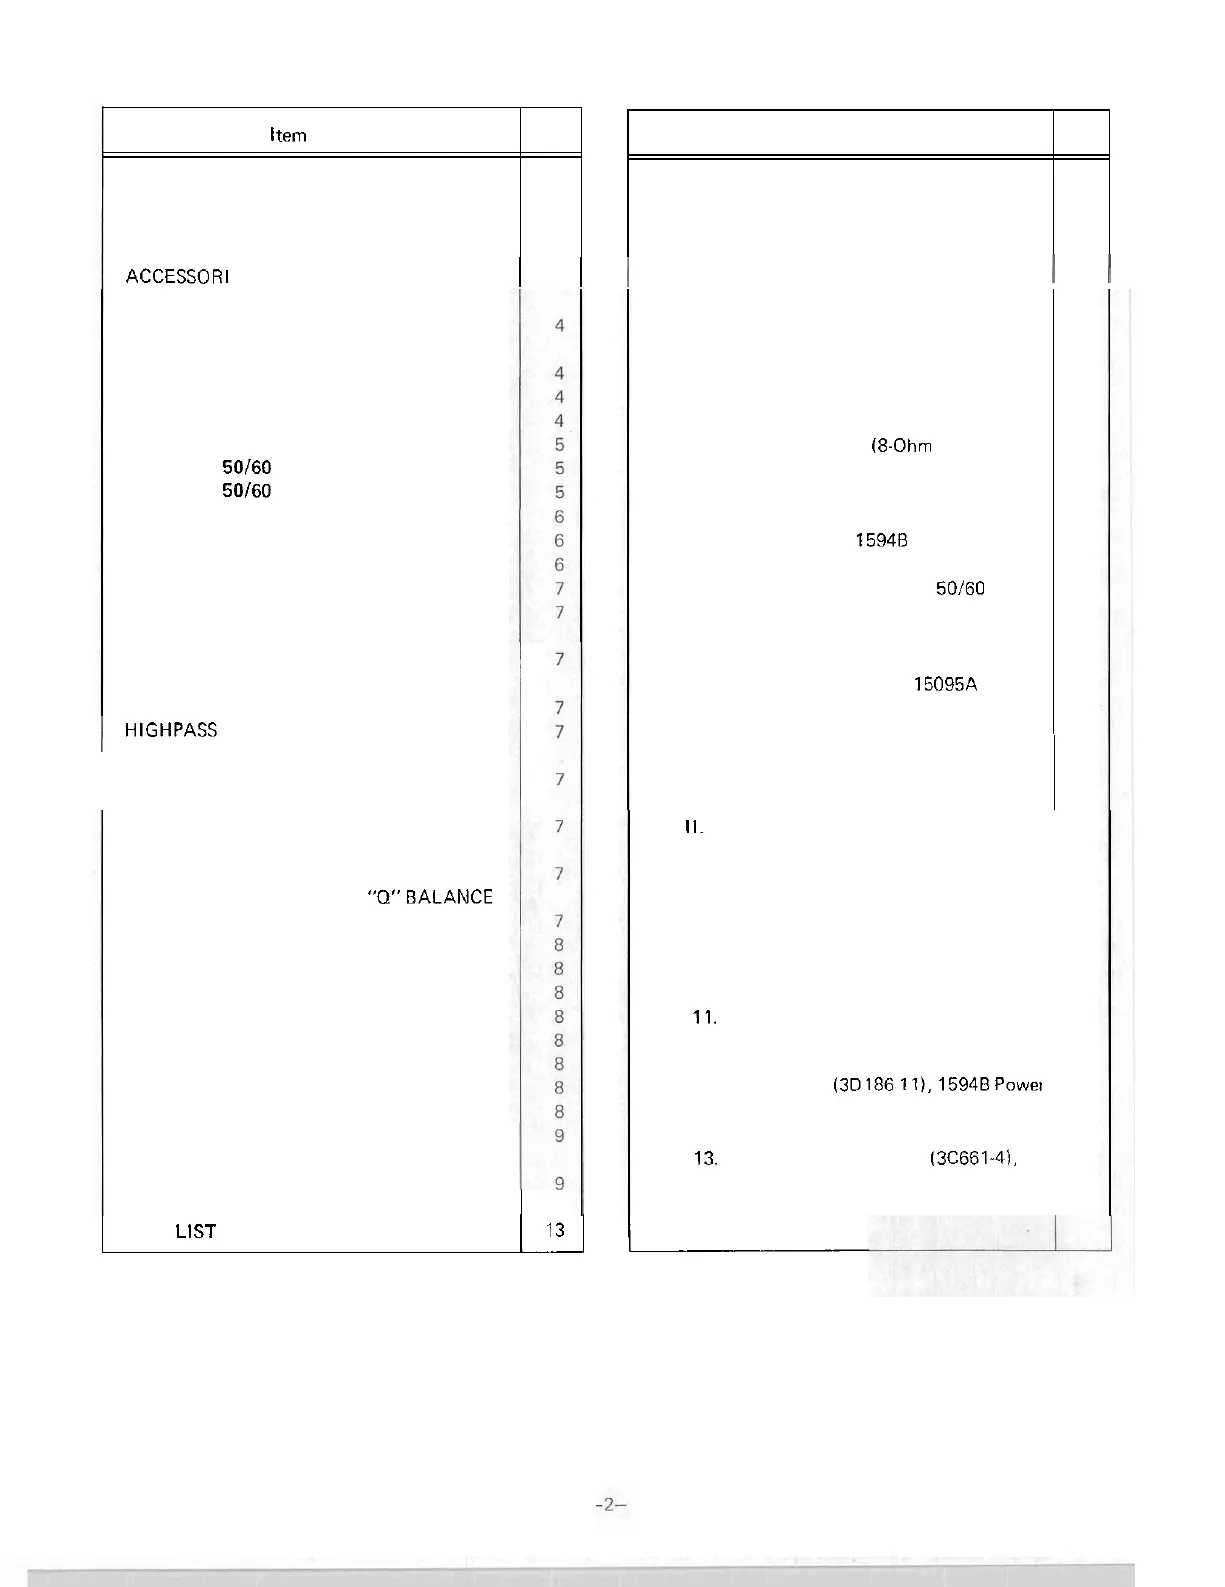
ACCESSOR l ES
1
4
1
I
Figure
2.
Typical Frequency Response
1
I
DATA CONTENTS
INSTALLATION
RACK INSTALLATION
SHELF INSTALLATION
VENTILATION
ELECTRICAL
120
Volt,
50160
Hz Power Connections
240
Volt,
50160
Hz
Power Connections
Battery Connections
lnput Connections
Output Connections
Speaker Matching
Speaker Power Distribution
l
tem
SPECIFICATIONS
DESCRIPTION
OPERATION
Page
3
4
Graphics
Figure 1.
Typical Power Output Versus Fre
-
quency for 0.5% THD and 1% THD
(8
-
Ohm Load)
CONTROLS AND INDICATORS
I
HIGHPASS FILTER
Page
3
SERVICE
ACCESS
ADJUSTMENT OF POWER DRIVER
BALANCE CONTROL
ADJUSTMENT OF OUTPUT
"Q"BALANCE
CONTROLS
ASSEMBLY REPLACEMENTS
Fuses
Pilot Lamp
Power Driver PCB
RECOMMENDED SERVICE TECHNIQUES
Transistor Orientation
Replacing Power Transistors
Testing Transistors
Replacing PCB Components
Repairing Fractured or Damaged PCB
Conductor
Characteristics
Figure
3.
Typical
%
THD Versus Frequency
for 100
-
Watt Output
Figure 4. Typical
%
THD Versus Wattage Out
-
put at 1000
Hz
(8-Ohm Load)
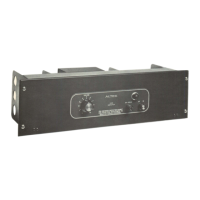
Figure
5.
Front View With Hinged Panel Open
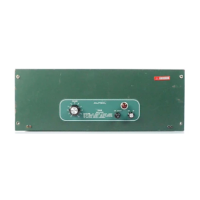
Figure 6. Rear View of
15948 Power Amplifier
Figure
7.
Converting to 240V ac, 50/60 Hz
Operation
3
3
3
4
5
6
Figure
8.
Socket Wiring for Transformer
-
Isolated lnput Using 15095A Line
Transformer
Table
II.
Speaker Outputs
Figure 9. Typical Solid
-
State Component
Configuration
Figure
10.
Component Locations Inside Main
Chassis
Figure
11.
Component Locations on Rear of
Chassis
Figure 12.
Schematic
(3D186 11). 15948 Power
Amplifier
Figure
13.
Component Locations 130661-41,
Power Driver PCB Assembly
6
Table
I.
Terminals and Applications of INPUT
Terminal Board
PARTS
LIST
IILl
I
6
 Loading...