Scoring Tests…
6
Tally of Incorrect Answers & Frequency Distribution
Report
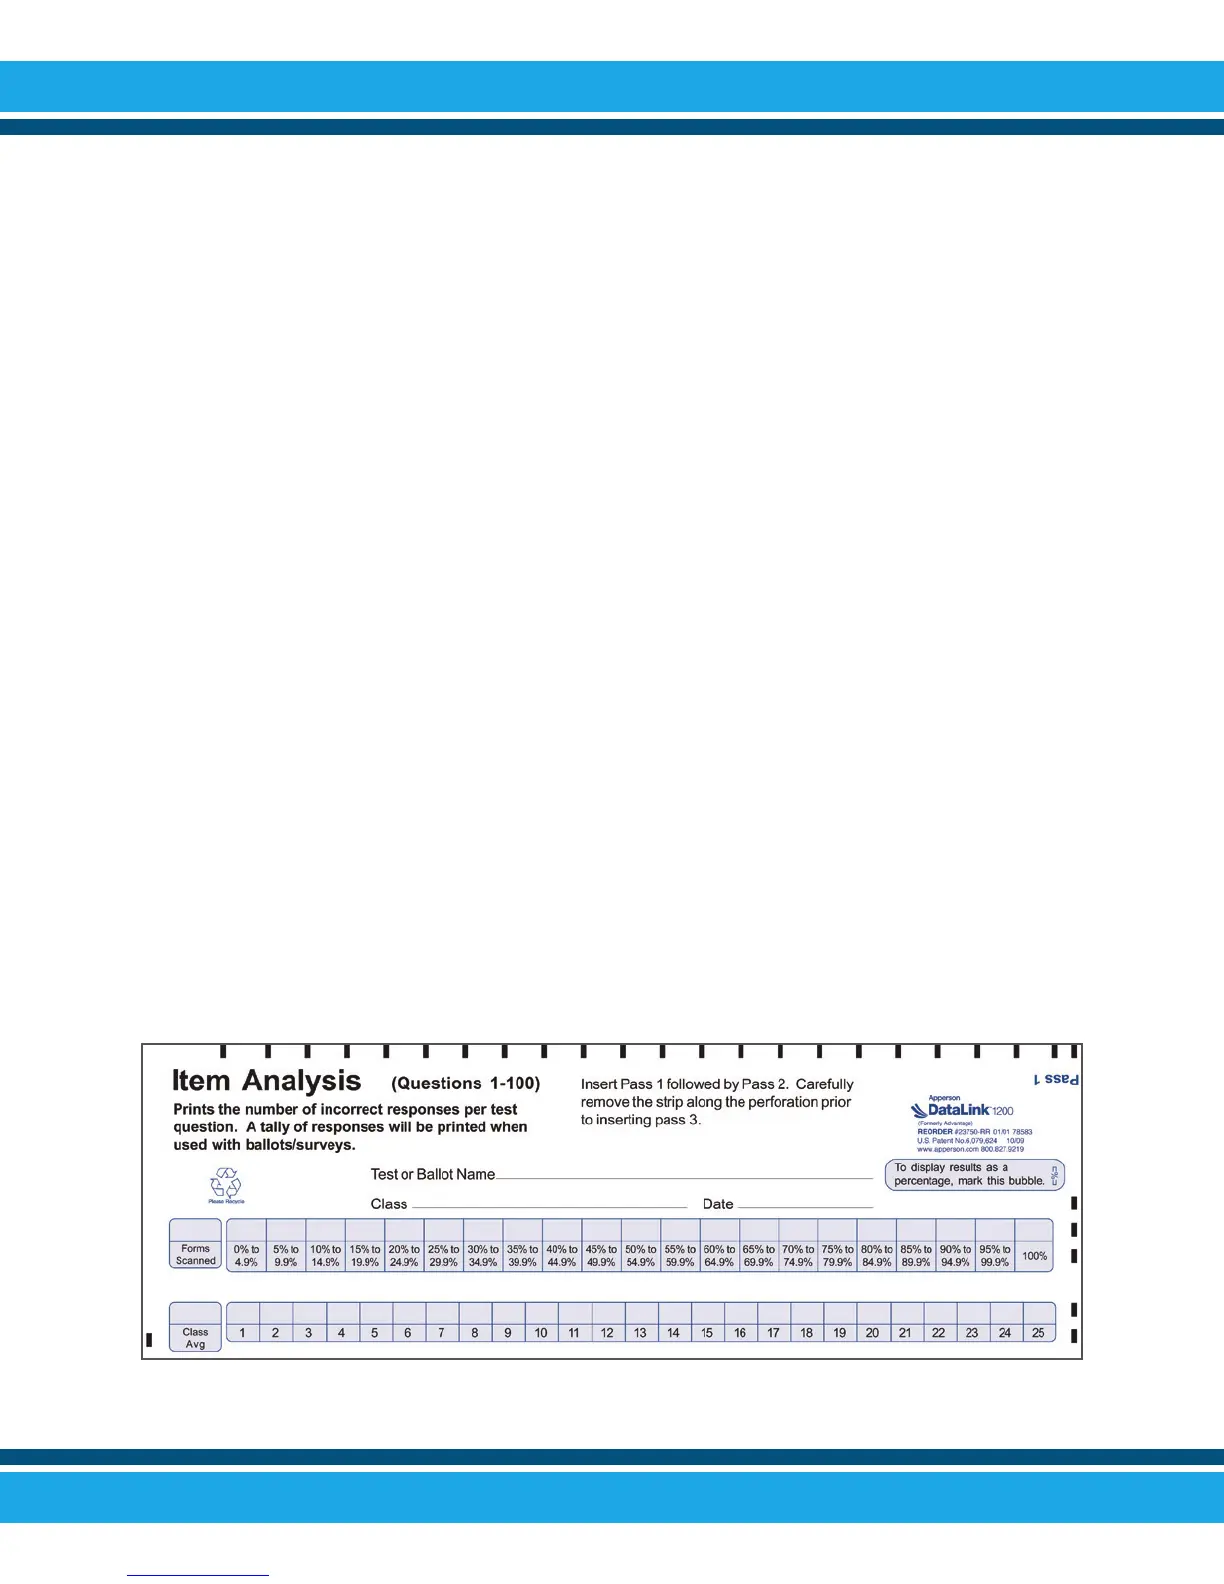
After processing a batch of answer sheets use the Item
Analysis Form 23570 to get a detailed report of the test. The
Item Analysis report will provide a frequency distribution of
scores in 5% increments. The report also lists the number of
wrong answers selected for each test question.
If the Item Analysis Form is not available, the number of wrong
answers per question can be viewed in the display window. To
view the number of wrong answers for each question, press the
“Summary Display” button twice. Follow the instructions
displayed in the window for viewing the tally of wrong answers.
While viewing this information you can continue processing
additional answer sheets at any time.


 To Next Page