Do you have a question about the Boston Scientific RHYTHMIA HDx and is the answer not in the manual?
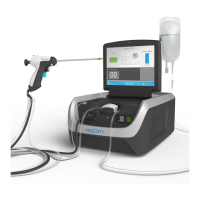
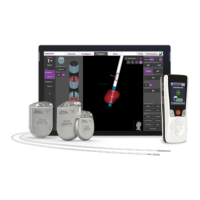
Lists system components including Signal Station, System Software, Workstation, and Accessories.
Lists single-use parts intended for system use but not included, like EP catheters and patch kits.
Explains the system's 3D mapping and navigation using continuous mapping and catheter localization.
States system operation is restricted to licensed medical practitioners and mapping specialists.
Advises frequent back-up routines to prevent data loss and careful handling of components.
Details precautions during procedures, like verifying connections, using imported shells as reference, and handling CIEDs.
Patients are at risk of arrhythmias due to programmed stimulation and catheter manipulation during EP procedures.
Poor localization or force measurements can lead to misinterpretation and patient injury.
Notes the potential risk of electrical shock to users, patients, and service representatives.
Describes accessing the Startup screen and its tabs for selecting modes.
Explains the distinct screens, features, and functions of the three system operation modes.
Used to set up studies, create, display, review, and edit real-time maps and data.
Used to prepare for a mapping study by defining, adding, or configuring catheters, electrodes, and signals.
Explains the auto-detect feature displaying SiS port status for connected peripherals and warning conditions.
Enables users to manage catheters and configure unipolar/bipolar channel settings.
Allows selection of low-pass/high-pass filters and line noise rejection for unipolar/bipolar channels.
Details how to display catheter channels, determine physical connections, and set labels.
Describes how users can add or remove catheters as needed from the system.
Refers to Figure 19 for details on the Sweep Graph.
Facilitates patient alignment to the magnetic field and selection of reference signals.
Details system verification of connection signal and quality after patient alignment.
Facilitates review of bipolar or unipolar signals for user-selected catheters.
Allows users to set up primary and secondary windows for study use, supporting up to four monitors.
Lists UI elements available for secondary windows, including graphs and views.
Toolbar for configuring mapping settings and starting mapping (Figure 10).
Panel to review and edit beat acceptance criteria for mapping modes.
Explains the necessity of the reference electrode for impedance location technology.
Describes system messages and localization generator status icons appearing on Live Mode screens.
Details how to manually disable/enable the localization generator for specific situations like CIED interference.
Explains cardiac tissue stimulation, channel routing, and warnings related to pacing signals.
Describes the display of 3D maps and catheter locations in Live or Review Mode.
Explains the use of the color bar as a legend for map color and electrogram values.
Details using the 3D orientation toolbar and mouse controls for map visualization.
Describes preserving map visibility in 3D View by clicking a padlock icon.
Information displayed at the bottom of 3D view, including volume, time, and accepted beats.
Feature to see internal features of a mapped structure by creating a cross-section view.
Explains how to access and adjust the clipping plane using drag controls or a pop-up menu.
Details collecting and displaying ECG and intracardiac signals on Sweep Graph and Beat Graph.
Shows multiple ECG/intracardiac electrograms for examining and comparing beats.
Includes a beat graph color bar to help understand activation time maps and annotate beats.
Used to search, view, edit, add, or remove recorded events and tags.
Synchronized graphs for reviewing study log data, available only for data review.
Describes the Slow Graph for viewing data at slow sweep speeds, toggling signals, and configuring traces.
Displays tag drop progress bars and coloring parameters associated with active AutoTag groups.
Expands the Map Initiation Tool to select mapping catheter, enter map name, and select chamber of interest.
Details map types: Anatomy Only, Activation or Voltage, and FrAP.
Describes three template types for initializing trigger settings: Detected, Previous, and Snapshot.
Used to select catheters visible on the 3D view and change certain catheter parameters.
Displays the portion of cardiac cycle analyzed for activation time and voltage, and how to adjust it.
Explains beat detection and designation of the timing reference channel for consistent analysis.
Explains how anatomical maps are created by aggregating catheter locations and options for including/excluding data.
Describes electroanatomical maps based on anatomical map, electrode location, and electrical activity.
Includes sequence of tissue electrical activation, determining activation time, and manual annotation.
Explains how the Beat Review Graph color bar synchronizes with activation time maps for interpretation.
Used to identify low voltage areas (scar) by displaying peak-to-peak voltage.
Used to identify areas with high electrogram fractionation based on number of activations.
Covers manual beat acquisition and continuous mapping for data collection.
Describes manually adding beats to a map by freezing the Beat Graph and reviewing electrograms.
Allows rapid map completion by continuously acquiring beats as catheter moves, using beat acceptance criteria.
Explains interpolating anatomical data to smooth meshes and fill gaps in sparse maps.
Describes the anatomy editing tool for selecting regions and modifying interpolation levels.
Explains visualizing acquired vs. interpolated data, with acquired data as opaque and interpolated as transparent.
Allows cloning of Activation Time, Voltage, and Anatomical Maps to create exact duplicates.
Lists tools for annotating and editing maps in Live Mode, shown in Figure 36.
Tool to create and manage manual and AutoTag groups, organize tags, and preview.
Invokes anatomy tagging mode to drop anatomy tags on the 3D view surface.
Tool to cut out and remove selected anatomy, like veins or valves.
Aligns imported anatomical shells to patient orientation or previously created 3D map.
Selects desired image capture method for full screen or partial image/video.
Activates the roving probe to place or move it to desired map locations.
Tool to measure distance between tags or surface area of a region on the 3D map.
Function in Live Mode to review maps and data, including electrograms and tags.
Lists four tagging options: Manual, Anatomy, Trace, and Automatic (AutoTag).
Details managing tags using the tagging window, creating tag groups, and setting active groups.
Explains organizing tag groups into folders for better management within the tagging window.
Discusses tagging location selection and tag projection appearance (sphere vs. disc).
Defines selecting the center or tip of the distal electrode for accurate tagging.
Explains how tag appearance depends on proximity to the anatomical surface and projection settings.
Describes using the Measurement Tool to measure distances between tags on a 3D map.
Explains the Tip to Closest Tag Distance tool for measuring proximity.
Details hiding tag groups or individual tags using eye icons in the Tagging Window or study log.
Allows converting tags to star shapes for marking locations of interest.
Describes displaying a preview ring on anatomy to identify where manual tags would appear.
Facilitates manual tagging of catheter location with respiration feedback in the tagging window.
Describes placing anatomy tags by invoking anatomy tagging mode and clicking on the anatomical surface.
Allows tagging from unipolar/bipolar traces by double-clicking on a trace in Beat Graph.
Tags placed automatically based on user-defined criteria, colored by parameters.
Collection of user-defined tag drop and coloring criteria to determine AutoTag placement and color.
How to set up and activate an AutoTag group, associating it with a tag group.
Conditions for AutoTag placement: active group, tracked catheter, and no data gaps.
Explains how AutoTags are colored based on five parameters and how coloring updates in real-time.
Describes user-selectable color palettes for AutoTags and how coloring is determined by thresholds.
Allows reprocessing an active AutoTag group by assigning a different preset.
Explains errors affecting tag drop/coloring parameters and how they are indicated.
Describes how new tags are added as study log entries and are searchable.
Covers adjusting mesh tightness and visualization options for newly acquired data.
Details the two types of anatomy editing: surface editing and volume editing.
Describes using the F5 key as a shortcut for the Scissors Tool.
Explains the undo/redo functionality for anatomy selections or deletions.
Uses magnetic fields from a generator to determine catheter position.
Tracks catheters without magnetic sensors using small currents and voltage measurements.
Creates an impedance field map to enhance impedance tracking accuracy by coupling with magnetic location.
Discusses visual indicators for tracking quality affected by factors like electrode connections and motion.
Provides a quality indicator for each magnetically tracked catheter, including features and indicators.
Automatic adjustment for impedance measurement degradation due to factors like motion or irrigation.
Minimizes on-screen effects of motion using a software-applied motion filter.
Corrects Non-Orion catheter rendering for motion, basing visualization on motion-corrected position.
Provides steps for poor location accuracy, including verifying connections and resetting field maps.
Helps target troubleshooting by observing visual trends in tracking quality graphs.
Explains the two location references: magnetic (back patch) and impedance (system reference electrode).
Provides qualitative understanding of catheter location relative to a 3D anatomical shell.
Represented by an outline or halo showing the area updated if data is added to the map.
Represented by a ring, proportional to distance, with different display inside/outside shell.
Describes visibility of internal/external catheter images and warnings when localization generator is disabled.
Details the four DirectSense UI elements: impedance graph, power bar, tip visualization, and value widget.
Shows raw and moving average local impedance data over time, with calibration mechanism.
Explains the power bar graphic and its visualization at the catheter tip.
Displays filtered impedance value in user-selectable modes.
Explains the warm-up process for IntellaNav StablePoint catheters before force data can be displayed.
Details the warm-up process in the Force value widget, including conditions and progress.
Explains the process of zeroing the force catheter after warm-up for accurate readings.
Lists the four elements of the Force Sensing UI: graph, tip visualization, value widget, and angle indicator.
Displays raw and filtered force data, with configurable thresholds and time history.
Depicts the force graphic at the catheter tip, similar to DirectSense visualization.
Displays numerical force value and angle indicator, with color-coded feedback.
Describes system detection of force catheter presence within compatible sheaths.
Explains changes in force UI elements during RF energy delivery, indicating ablation status.
Lists items within the LUMIPOINT control panel, such as search tools and settings.
Details LUMIPOINT tools accessible via control panel or Beat Review Graph.
Highlights map regions activating at a certain time, with desired strictness criteria.
Highlights regions activating at a certain time and exhibiting multiple activation components.
Highlights regions exhibiting discontinuous activation anywhere within the mapping window.
Allows saving and recalling activation category settings, with options to save and recall.
Plots a histogram of normalized surface area active at different times across the mapping window.
Plots relative activation of electrograms within a user-defined radius around the roving probe.
Allows changing annotation of highlighted electrograms based on user-defined targets.
Introduces new visuals for LUMIPOINT, describing anatomic area, electrogram area, and time period of interest.
Extends LUMIPOINT functionality to review Orion data initially collected without the module.
Allows importing pre-acquired DICOM images and segmentation of cardiac chamber using ITK-SNAP.
Allows importing pre-segmented DICOM and VTK file formats.
Facilitates review of map data and map editing in Live or Review Mode.
Selects display of live or recorded catheter locations in the 3D View.
Tool for evaluating large amounts of map data by positioning a probe to view electrograms.
Helps find earliest activation points on unipolar/bipolar Activation Time Maps using the Roving Probe.
Allows editing individual points on a map in dynamic review, such as changing timing or deleting electrograms.
Allows exporting study data to MATLAB-compatible files in various formats: Basic, Advanced, Ablation.
Supports wired Ethernet connection for importing/exporting studies via network.
Details configuring a new file share, including name, path, credentials, and testing connection.
Continues troubleshooting guide for software issues, including Signal Station and localization errors.
Continues troubleshooting guide for software issues, including device errors and cable mismatches.
Continues troubleshooting guide for software issues related to catheter tracking and electrode problems.
Continues troubleshooting guide for software issues, including magnetic localization and ablation generator connection problems.
Continues troubleshooting guide for software issues, including DirectSense saturation and sheath detection errors.
Continues troubleshooting guide for software issues, including disk space, memory, and CPU synchronization errors.
Continues troubleshooting guide for software issues, including force connection box and catheter errors.
Continues troubleshooting guide for software issues, including force catheter errors and sheath detection unavailability.
Continues troubleshooting guide for software issues, including force data packet drop and catheter incompatibility.
| Brand | Boston Scientific |
|---|---|
| Model | RHYTHMIA HDx |
| Category | Medical Equipment |
| Language | English |