5
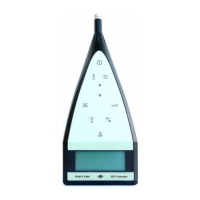
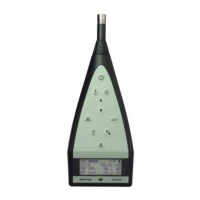
Fig. 2
Typical display when
measuring
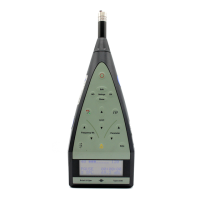
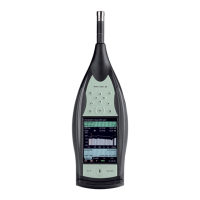
Fig. 3
Typical display when
modifying/updating the
measurement setup
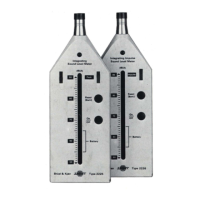
Fig. 4
Alternative display
colour schemes – the
left-hand display
shows the maximum-
contrast bright sunlight
display. The right-hand
display shows the night
time display, which is
optimised to take into
account the physiology
of human vision,
allowing you to read
the display without
ruining your night
vision.
You can view any quantity being measured, either during your measurement, or at any time
later. This also includes data transferred to a PC.
In all configurations, Type 2250 offers a variety of views of the same measurement. These
views have no impact on the measurement, but they allow you to see exactly what you want,
without interfering with any data. If, for example, you are logging broadband values as well
as spectra, you can choose to observe the profile, the time history, the overall or current
spectrum, or the overall or current broadband values. The choice of display has no influence
on what is measured or stored.
Status field:
• Path and name of current project
• Immediate textual feedback
when pressing the keys
• Information on measurement
status
Shortcut bar:
• Main menu button, brightness ad-
just, help, battery level, clock
View area:
• Contains all the parameters
and results in numerical or
graphical format
• More than one view can be
used for displaying the in-
formation
• Select view using the View
Tabs at bottom of view area
View tabs
Selected Project Template
(including display and
measurement set-up)
Close and return to
measurement
Parameter values:
• Changed via drop-downs
• Active element is highlighted
Shortcut bar:
• Main menu button, brightness
adjust, help, battery level, clock
View area
View tabs
 Loading...