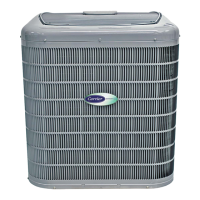
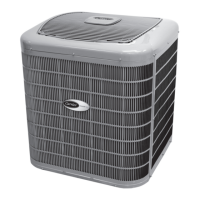
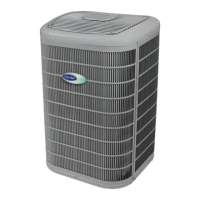
EER Rating vs. Equipment payback
The published EER rating represents efficiency of cooling products at peak load, or 95ºF
(35ºC). This rating is driven by utility companies that are concerned with power
consumption at peak demand periods. In most locations, peak load is experience for a very
short time during a year (see charts below). The Infinity
®
19VS system is designed for high
efficiency at lower load conditions, which represents the vast majority of the cooling season.
This is why the SEER ratings are high, but the EER is not as high on all sizes as other high-
efficiency products. Focusing on SEER allows the smaller unit design, and competitive price
compared to high EER variable speed products. Some incentives and local rebates contain
an EER requirement, while others do not.
A cost payback analysis should be done to compare benefit of a rebate with higher EER
component vs. initial cost and energy savings. Things to consider regarding rebates
containing EER requirements:
(Cost of qualifying EER equipment) – (rebate amount) = ______________
Cost of Infinity 19VS equipment = _____________
Yearly operating cost of qualifying EER equipment using Opcost calculator = __________
Yearly operating cost of 19VS equipment using Opcost calculator = _____________
(Difference in system cost) /( yearly operating cost of 19VS – yearly operating cost from
high EER equipment) = _____
The end number above represents number of years for payback of the additional
investment for equipment to achieve the rebate.
2.22%
0.18%
0.08%
27.00%
6.25%
0.72%
7.83%
1.22%
1.47%
0.42%
St Louis, MO Baltimore, MD Orlando, FL Phoenix, AZ Dallas Ft
Worth, TX
Minneapolis,
MN
Sacramento,
CA
Portland, OR Richmond, VA Atlanta, GA
Avg. Percent of Hours 95° F and Above
97.8%
99.8%
99.9%
73.0%
93.7%
99.3%
92.2%
98.8%
98.5%
St Louis, MO Baltimore, MD Orlando, FL Phoenix, AZ Dallas Ft Worth,
TX
Minneapolis, MN Sacramento, CA Portland, OR Richmond, VA
Avg. Percent of Cooling Hours 70° to 90° F

 Loading...
