19990401
○○○○○
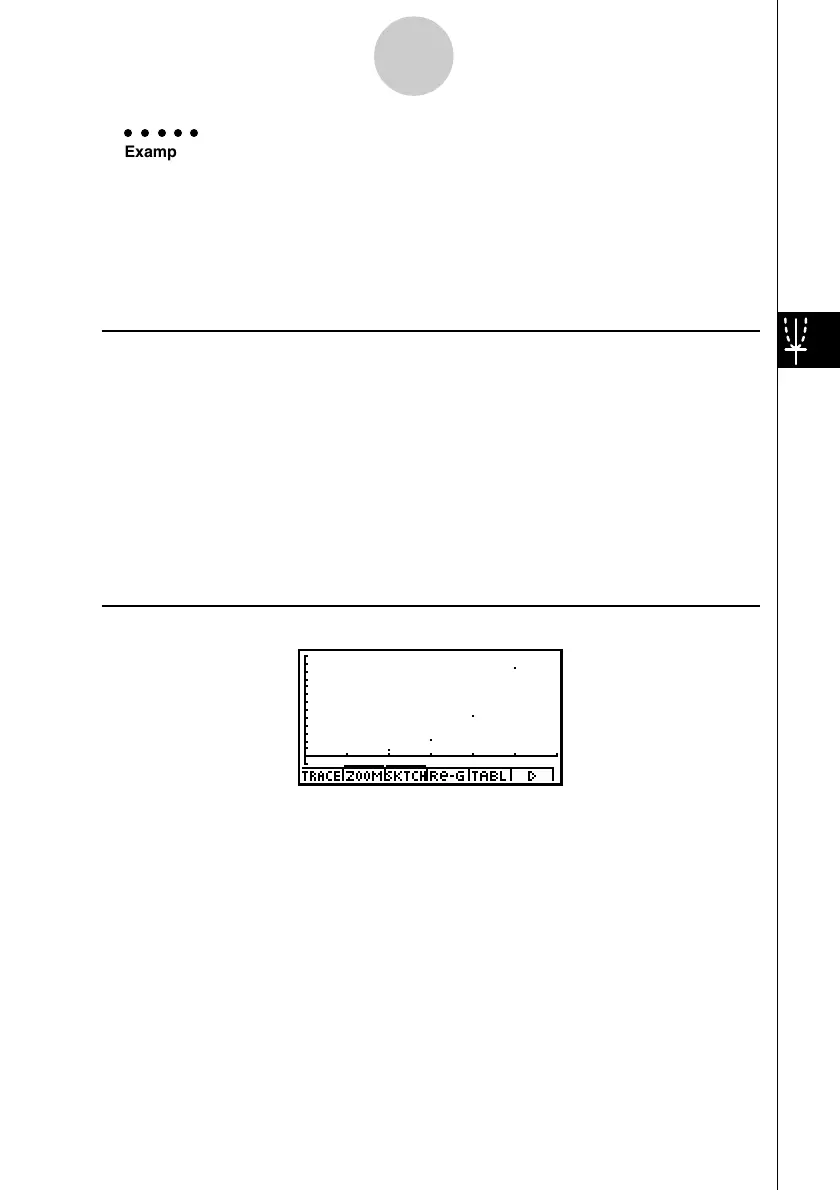
Example Generate a number table from recursion between two terms as
expressed by an+1 = 2an+1, with an initial term of a1 = 1, as n changes
in value from 1 to 6. Use the table values to draw a plot line graph with
ordinate Σan , abscissa n.
Use the following V-Window settings.
Xmin = 0, Xmax = 6, Xscale = 1
Ymin = –15, Ymax = 65, Yscale = 5
Procedure
1 m
RECUR
2 u3(SET UP)1(On)i
3 !K(V-Window) awgwbwc
-bfwgfwfwi
4 3(TYPE)c(an+1=)c2(an )+bw
5 5(RANG)2(a1)bwgwbwi
6 6(TABL)
7 6(G
•
PLT)c(Σan)
Result Screen
5-9-6
Graphing a Recursion Formula
 Loading...