Graph & Table
Menu
1. If a ball is tossed upwards with an initial velocity
of 56 ft/sec from an initial height of 120 feet, graph
the height of the ball, as a function of time.
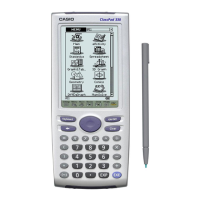
From the Menu, select the Graph & Table icon.
Enter the function as y1.
To set a window tap 6, enter the values and tap
OK.
Tap
$ to graph.
Getting Started with the Classpad II
14
 Loading...

