EasyManua.ls Logo

Casio CLASSPAD II User Manual

Casio CLASSPAD II
44 pages
To Next Page IconTo Next Page
Page #1 background imageLoading...
Page #1 background image
Press these keys for numbers, basic operations,
and the most common variables
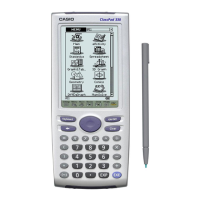
Tap any icon to select the application.
Tap m at any time to return to the menu screen.
Tap M at any time to return to the Main menu.
Tap to advance to the next page.
In any menu application, press k for
the onscreen keyboard.
Press c to power on. Then press c
to clear commands. Press Kc to
power off.
Press these keys for numbers, basic operations,
and the most common variables
Press E to execute commands.
ClassPad II
Quick
Reference Guide
White gradient to 50% transparency.
Note this logo is on separate layer from background
Press these keys for numbers, basic operations,
and the most common variables
Question and Answer IconNeed help?

Do you have a question about the Casio CLASSPAD II and is the answer not in the manual?

Casio CLASSPAD II Specifications

General IconGeneral
DisplayColor LCD
Resolution320 x 528 pixels
Operating SystemCasio OS
Internal Memory16MB
ConnectivityUSB
Power4 AAA batteries
Weight320 grams

Summary

Main Menu Operations

Ball Trajectory Calculations

Compute ball height and time using physics models and calculator input.

Finding Maxima and Derivatives

Use fMax and diff commands to find maxima and compute derivatives.

Symbolic Algebra and Equation Solving

Utilize CAS for factoring, variable manipulation, and solving equations.

Velocity from Position Function

Derive velocity from the position function using the derivative.

Numerical Solve Menu

Solving for Time Numerically

Numerically solve for time given initial conditions and target height.

Finding Initial Velocity Numerically

Numerically solve for initial velocity using height and time.

Graph & Table Menu

Graphing Functions and Tables

Enter and graph functions, set view windows, and create tables.

Analyzing Graph Features

Trace graphs, find values at specific points, and mark coordinates.

Solving for Graph Intercepts/Extrema

Use G-Solve to find intercepts, y-values, and maxima on graphs.

Exploring Graph Transformations

Investigate how coefficient changes affect quadratic graph transformations.

Conic Menu

Graphing Conic Sections

Graph hyperbolas and other conics using standard/general forms.

Analyzing Conic Properties

Display vertices, foci, and asymptotes using G-Solve.

Graphing Rotated Conics

Graph and analyze rotated conics via the general form.

Statistics Menu

Categorical Data Plotting

Construct pie charts and bar charts from categorical data.

Quantitative Data Visualization

Generate histograms and box plots for quantitative data sets.

Calculating Summary Statistics

Compute one-variable statistics like mean, median, and quartiles.

Related product manuals