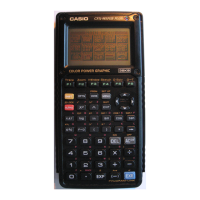
Do you have a question about the Casio CFX-9850GB PLUS and is the answer not in the manual?
Steps to enter GRAPH mode and use the Graph Function menu.
Procedure for attaching the calculator case and removing the back cover.
Instructions for correctly loading the calculator batteries.
Steps to remove the insulating sheet marked 'BACK UP'.
Procedure for replacing the back cover and initial power-on.
How to access the Main Menu and its appearance on different models.
Navigating to the contrast adjustment screen using cursor keys.
Steps to adjust display contrast and color tint on the calculator.
How to exit the contrast adjustment screen using the MENU key.
Visual representation of the calculator's main menu options.
Interface for adjusting display color, contrast, and tint.
Menu for managing and drawing graph functions.
Examples of displayed graphs and their associated data.
Display showing graph data alongside a numeric table.
Example of a dynamic graph changing with parameter values.
Combined display of numeric table and associated graph.
Example of a graph illustrating recursion convergence/divergence.
Steps to enter GRAPH mode and input the Y=sin X function.
Using the COLR function to select graph colors like blue, orange, or green.
Specifying the desired color for the graph using function keys.
Executing the DRAW command to display the graph.
How to use the Alpha Lock feature for continuous alphabetic input.
Detailed reference of calculator keys and their page numbers.
| Digits | 46 digits |
|---|---|
| Display size (HxV) | 21 8 mm |
| Memory type | 28kb |
| Battery type | AAA |
| Weight | 215 g |
|---|---|
| Dimensions (WxDxH) | 90 x 25 x 183 mm |


