rx-R
CONTROL
CHART----------------------
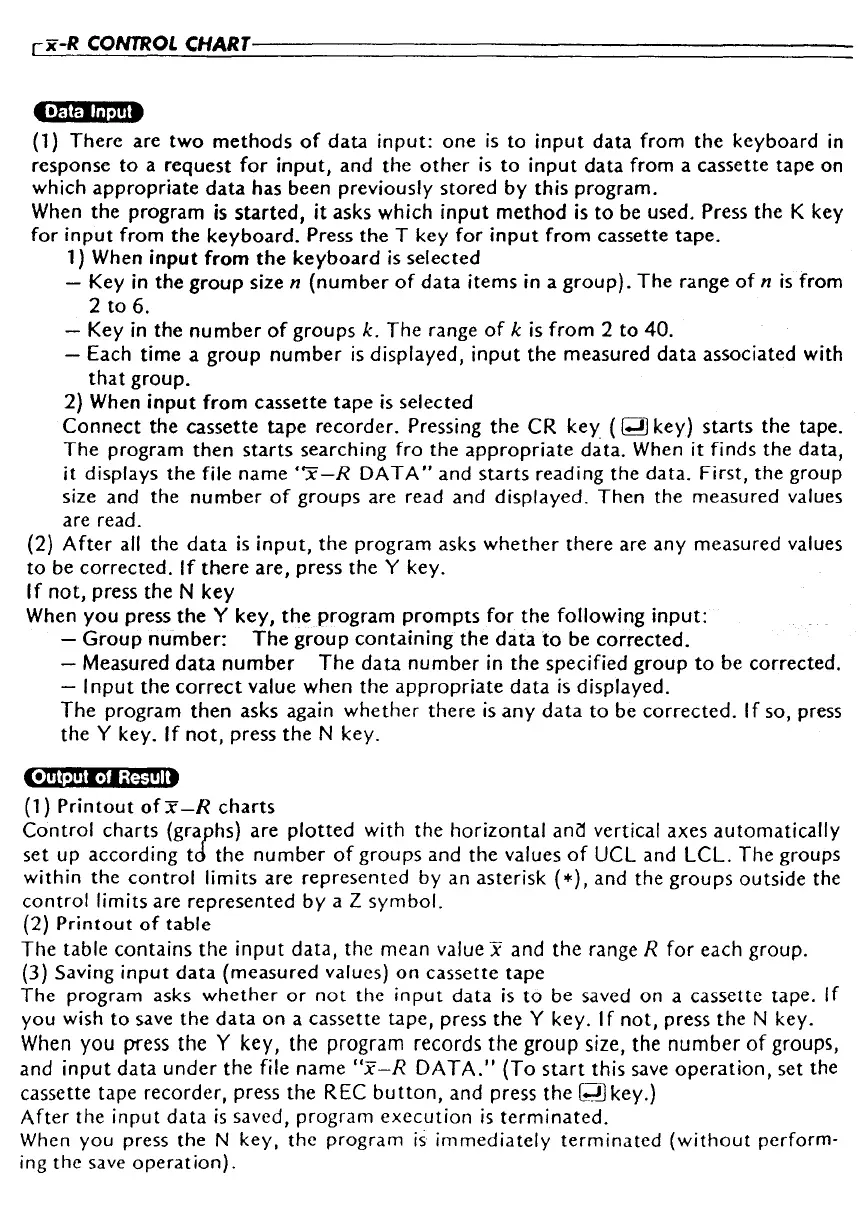
(1) There are
two
methods
of
data
input:
one
is
to
input
data from the keyboard
in
response
to
a request
for
input,
and the
other
is
to
input
data
from a cassette tape on
which
appropriate
data
has been previously stored by this program.
When the program
is
started,
it asks which
input
method
is
to
be used. Press the K key
for
input
from
the
keyboard.
Press
the
T key for
input
from
cassette
tape.
1)
When
input
from
the
keyboard
is
selected
- Key
in
the
group
size n
(number
of
data
items in a
group).
The
range
of
n
is
from
2
to
6.
- Key
in
the
number
of
groups
k. The range
of
k is
from
2
to
40.
- Each time a
group
number
is
displayed,
input
the measured
data
associated with
that
group.
2) When
input
from
cassette
tape
is
selected
Connect
the cassette
tape
recorder. Pressing
the
CR
key
(
gJ
key)
starts
the
tape.
The
program
then
starts
searching fro
the
appropriate
data. When it finds
the
data,
it displays
the
file name
"x-R
DATA"
and
starts
reading the data. First, the group
size and the
number
of
groups are read and displayed.
Then
the measured values
are read.
(2)
After
all
the
data
is
input,
the
program asks
whether
there
are any measured values
to
be corrected. If
there
are, press the Y key.
If
not,
press
the
N
key
When
you
press
the
Y key,
the
program
prompts
for
the
following
input:
-
Group
number:
The
group
containing
the
data
to
be
corrected.
- Measured
data
number
The
data
number
in
the specified
group
to
be corrected.
-
Input
the
correct
value when
the
appropriate
data
is
displayed.
The
program
then
asks again
whether
there
is
any
data
to
be
corrected.
If so, press
the Y key. If
not,
press
the
N key.
C•mt:mEl;{41
1
ii
■
(1)
Printout
ofx-R
charts
Control
charts (graphs) are
plotted
with the
horizontal
ancl
vertical axes
automatically
set
up according
td
the
number
of
groups
and
the
values
of
UCL and LCL.
The
groups
within the
control
limits are represented by an
asterisk(*).
and the
groups
outside the
control
limits are
represented
by
a Z
symbol.
(2)
Printout
of
table
The
table
contains
the
input
data,
the mean value x and
the
range R
for
each group.
(3) Saving
input
data
(measured values)
on
cassette
tape
The program asks
whether
or
not
the
input
data
is
to
be saved on a cassette tape. If
you wish
to
save
the
data
on
a cassette tape, press
the
Y key. If
not,
press
the
N key.
When you
press the Y key, the program records
the
group
size, the
number
of
groups,
and
input
data
under
the
file
name
"x-R
DATA."
(To
start
this save
operation,
set the
cassette tape recorder, press the REC
button,
and press
the
gJ
key.)
After
the
input
data
is
saved, program
execution
is
terminated.
When you press the N key, the program
is
immediately
terminated
(without
perform-
ing the save
operation).
44
 Loading...