EasyManua.ls Logo

Casio FP-200 - Page 47

Casio FP-200
156 pages
To Next Page IconTo Next Page
To Previous Page IconTo Previous Page
Loading...
BUSINESS_]
records+
1.
After
you
input
the
data,
reset
the
MODE switch
to
BASIC and
start
the
program.
Press any key on the
keyboard
and
the
program
will ask
whether
a
P-chart
or
a
Pn-
chart
is
required.
Select
the
appropriate
chart.
Next
input
the
data
file
number
and
the
number
of
groups.
The
plotter
then
plots
the
specified
control
chart.
This program
(more
precisely,
CETL)
performs
the
following calculations:
-
Defect
percentage
of
each
group
P =
Pn/n
x 100
(%)
- Average
defect
percentage P =
1:
Pn/1: n x 100
(%)
- Control limits
CL=
P
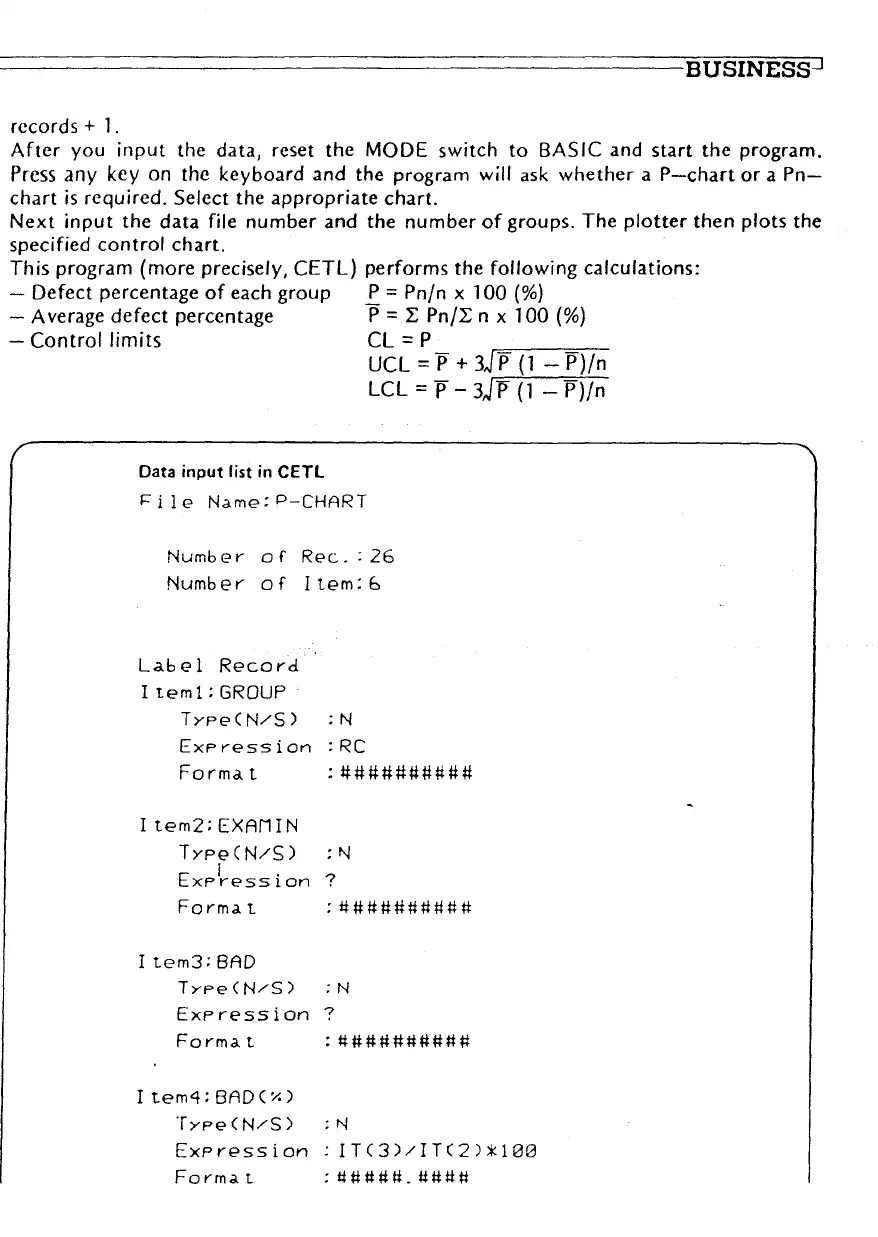
Data
input
list in CETL
~ile
Name:P-CHART
UCL=P+3JP
(1-P)/n
LCL=p-3JJ>(l
-P)/n
Number
of
Rec.
:26
Number
of
Item:6
Label
Record
Iteml:GROUP
TYPe(N/S)
:N
ExPression
:RC
Format
:##########
Item2:EXAMIN
TYPe(N/S)
: N
E ! .
XPl'E'SSlOn
?
Format
:##########
Item3:BAD
TYPe(N/S)
:N
Expression
?
Format
:##########
Item4:BADCx)
TYPe(N/S)
: N
Expression
:
ITC3)/IT(2).t100
Format
:#####.####
51

Other manuals for Casio FP-200

Related product manuals