EasyManua.ls Logo

Casio FP-200 - Plotter-Printer Graphic Tool; Program Outline; Data Input and Subtotal Output

Casio FP-200
156 pages
To Next Page IconTo Next Page
To Previous Page IconTo Previous Page
Loading...
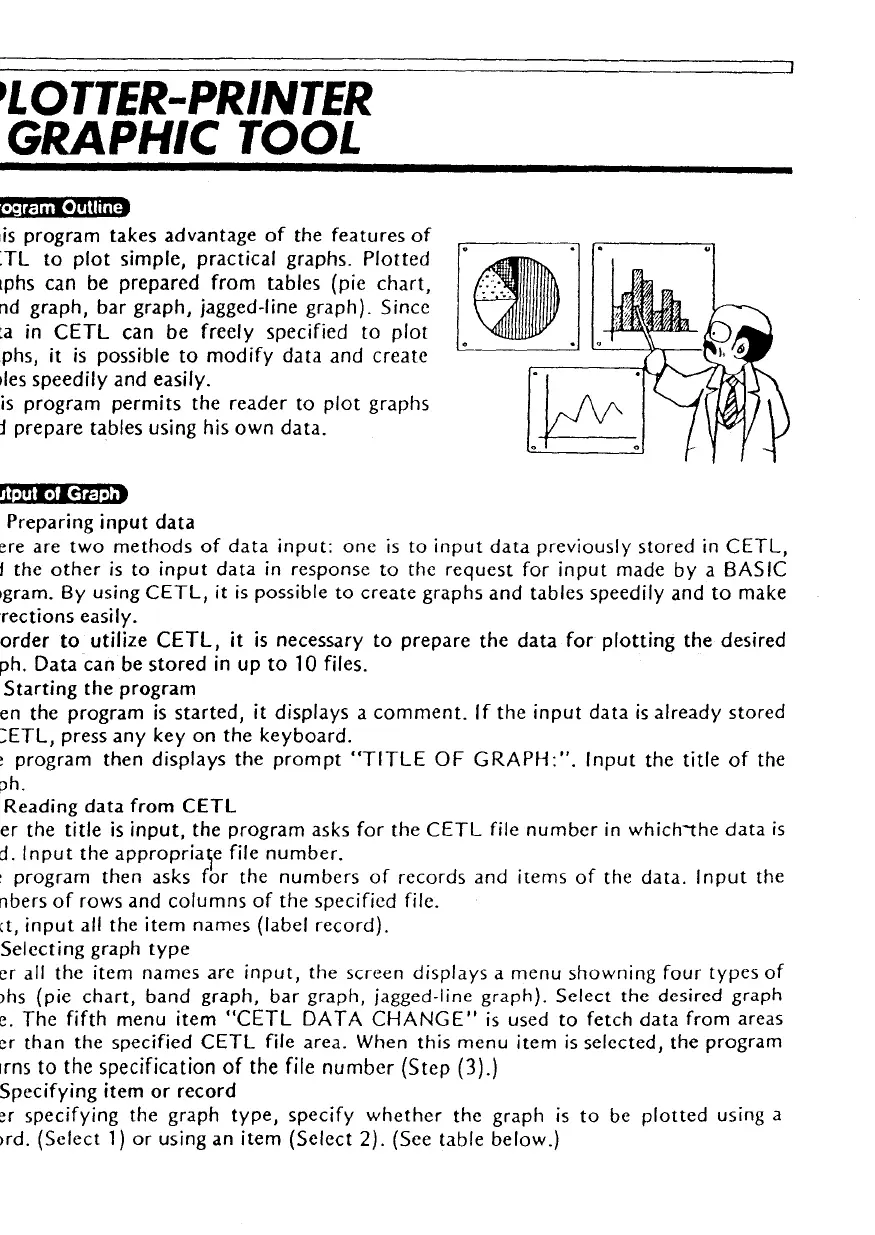
PLOTTER-PRINTER
GRAPHIC TOOL
This
program
takes
advantage
of
the
features
of
CETL
to
plot
simple, practical graphs.
Plotted
graphs
can
be
prepared
from
tables (pie
chart,
band
graph,
bar
graph,
jagged-line
graph).
Since
data
in
CETL
can
be
freely specified
to
plot
graphs, it
is
possible
to
modify
data
and
create
tables
speedily
and
easily.
This
program
permits
the
reader
to
plot
graphs
and
prepare
tables using his
own
data.
c
•rnmn
r:,
1C1t:1m.
(1) Preparing
input
data
There
are
two
methods
of
data
input:
one
is
to
input
data
previously
stored
in
CETL,
and
the
other
is
to
input
data
in
response
to
the
request
for
input
made
by
a BASIC
program. By using
CETL,
it
is
possible
to
create
graphs
and
tables
speedily
and
to
make
corrections
easily.
In
order
to
utilize
CETL,
it
is
necessary
to
prepare
the
data
for
plotting
the
desired
graph.
Data
can
be
stored
in
up
to
10
files.
(2)
Starting
the
program
When
the
program
is
started,
it displays a
comment.
If
the
input
data
is
already
stored
in
CETL,
press
any
key
on
the
keyboard.
The
program
then
displays
the
prompt
"TITLE
OF
GRAPH:".
Input
the
title
of
the
graph.
(3) Reading
data
from
CETL
After
the
title
is
input,
the
program
asks
for
the
CETL
file
number
in
which""the
data
is
filed.
Input
the
appropria~e file
number.
The
program
then
asks for
the
numbers
of
records
and
items
of
the
data.
Input
the
numbers
of
rows
and
columns
of
the
specified file.
Next,
input
all
the
item
names
(label
record).
(4)
Selecting
graph
type
After
all
the
item
names
are
input,
the
screen
displays a
menu
showning
four
types
of
graphs (pie
chart,
band
graph,
bar
graph,
jagged-line
graph).
Select
the
desired graph
type.
The
fifth menu item
"CETL
DATA
CHANGE"
is
used
to
fetch
data
from
areas
other
than
the
specified
CETL
file area. When
this
menu
item
is
selected,
the
program
returns
to
the specification of the
file
number (Step (3).)
(5)
Specifying
item
or
record
After
specifying the
graph
type,
specify
whether
the
graph
is
to
be
plotted
using a
record.
(Select
1)
or
using an
item
(Select
2).
(See
table
below.)
99

Other manuals for Casio FP-200

Related product manuals