E-9
Perform the following calculation: Rref Mat A
))
*(MAT)(E)(Rref)
(E)(Mat)?T(A)
U
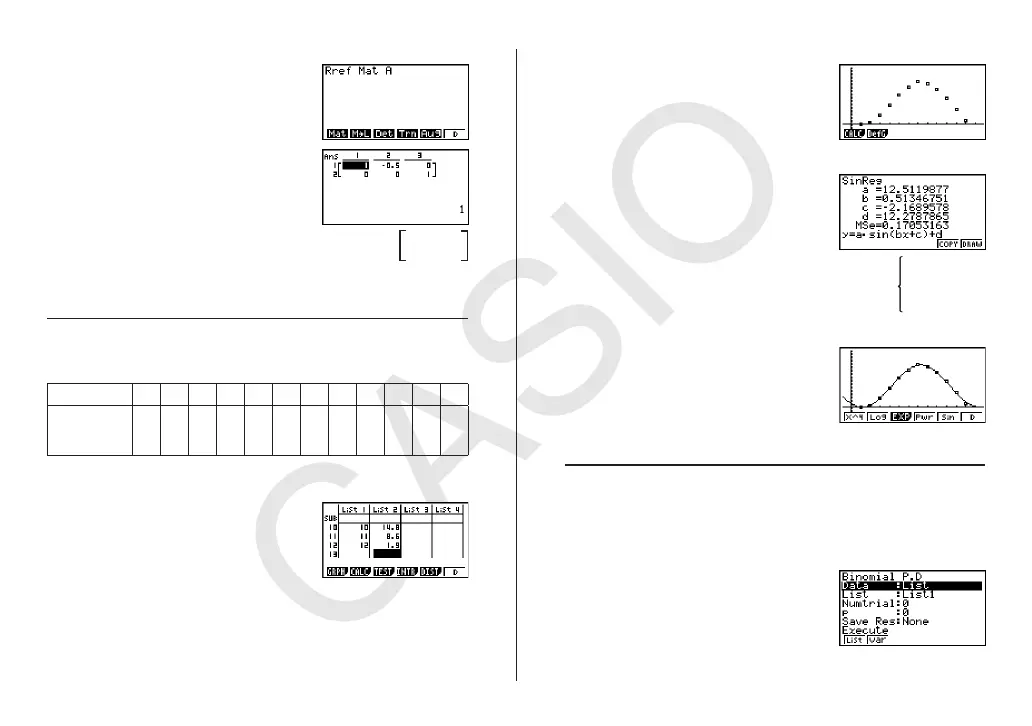
Actual result:
1 –1/2 0
0 0 1
From this result, it can be determined that there is no solution for the
simultaneous equation.
Statistical Calculations
Example: To analyze average monthly temperatures in New York
Month Jan Feb Mar Apr May Jun Jly Aug Sep Oct Nov Dec
Average
Temperature
(°C)
0.1 0.8 5.1 11.2 16.8 22 24.8 23.8 20.2 14.8 8.6 1.9
Enter numbers for the months into List 1, and the corresponding average
temperature values into List 2.
KA(STAT)
@UAUBUCUDU
EUFUGUHU@?U
@@U@AUC
?@U?GUD@U
@@AU@EGUAAU
ACGUABGU
A?AU@CGU
GEU@HU
Plot the data on a graph.
(GRPH)(GPH1)
Use sin regression to obtain sinusoidal regression analysis results.
(CALC)(E)(Sin)
Actual result: Coefficients of
y = a·sin (bx + c)+d are
a
= 12.5119877
b
= 0.51346751
c
= –2.1689578
d
= 12.2787865
Use the analysis results to draw the sinusoidal regression graph.
(DRAW)
Actual result: Graph is drawn along plotted points.
Distribution Function
Example: Five trials of some even are performed, and one trial is successful.
If the probability of success of the event is 0.2, determine the
probability of the result obtained.
Use the binomial distribution Binomial P.D to perform the calculation.
KA(STAT)
(DIST)(BINM)(Bpd)
 Loading...


