E-13
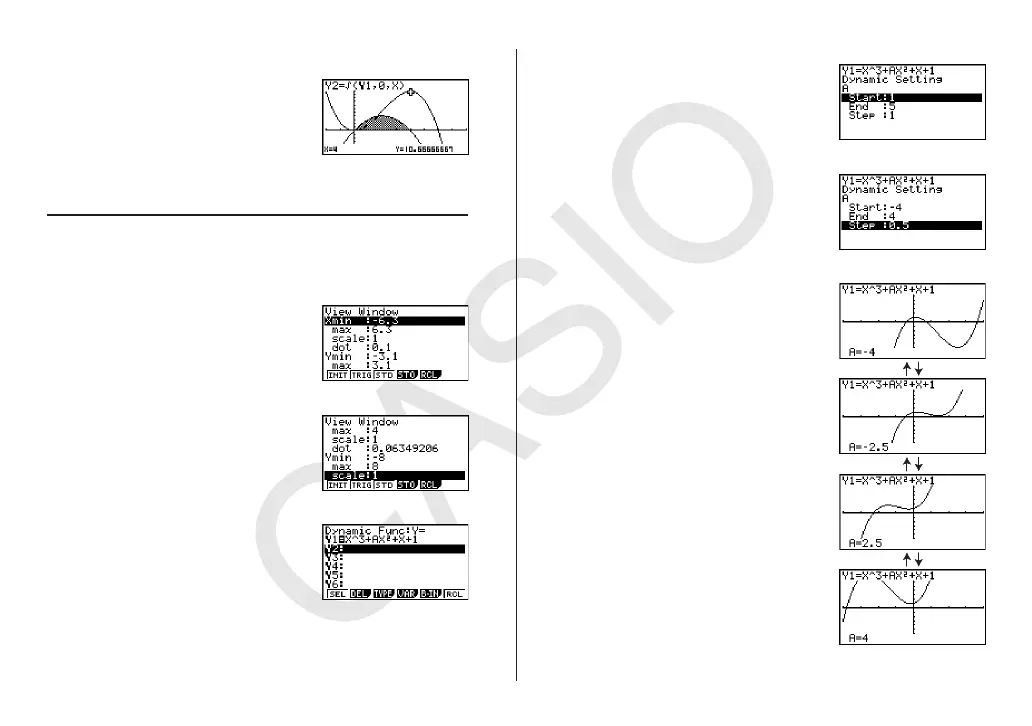
Use the D and A keys to select one of the graphs and specify the
coordinate position you want to trace.
DCU
Trace result: 10.66666667
Confirm that the same result is obtained in both cases.
Dynamic Graph
Example: To view how a graph is affected as the value of A in y = x
3
+Ax
2
+ x
+ 1 changes
Use View Window to configure the graph screen coordinate values.
KE(DYNA)
K(SET UP)(Line))
(V-WIN)
Configure the following settings: Xmin = −4, Xmax = 4, Ymin = −8, Ymax = 8.
CUCUAAGU
GU
Input
y = x
3
+Ax
2
+ x + 1 into area Y1.
)
T,B?T(A)
TVT@U
Configure movement range for variable A.
(VAR)(SET)
Configure the following settings: Start = −4, End = 4, Step = 0.5.
CUCU?DU
Execute the Dynamic Graph operation.
)(DYNA)




 To Next Page