fx-9860GII Quick Start Guide
9
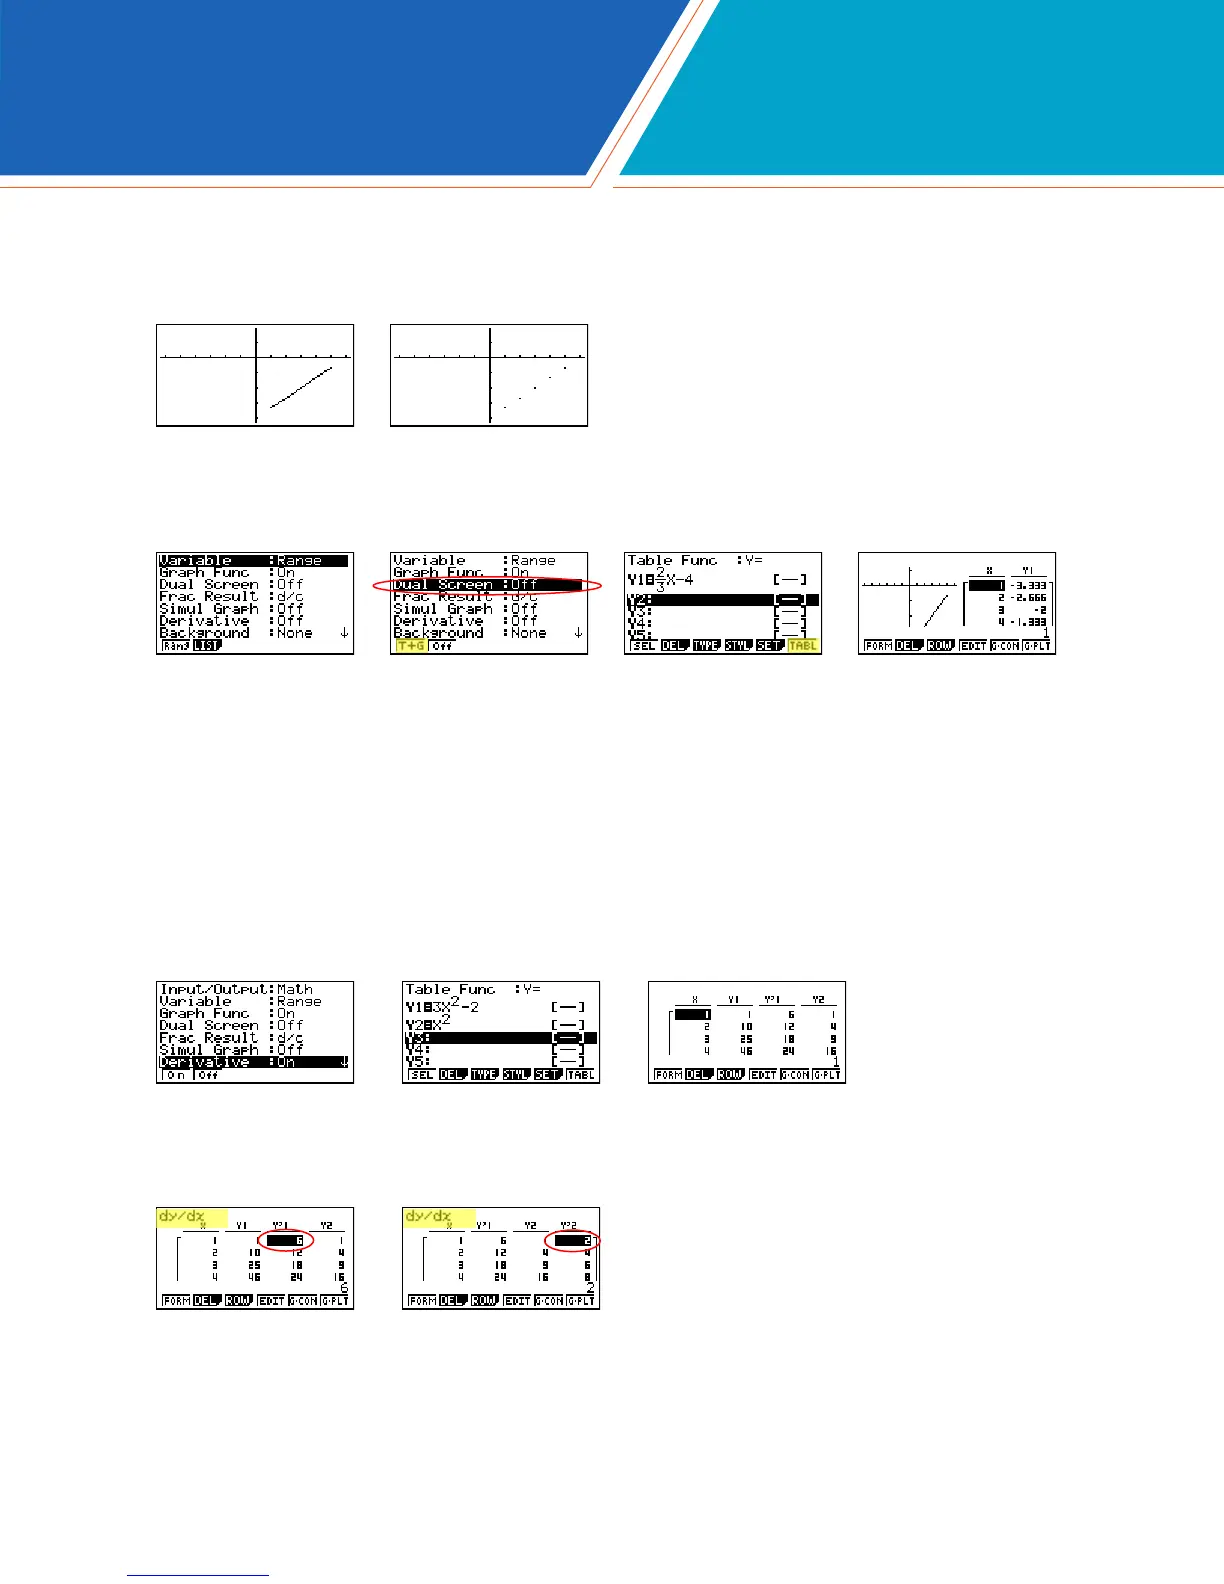
4. From the table view screen, you can press y(G-CON) to see a connected plot linear graph or
u(G-PLT) to see a plot graph for the function you entered.
Note: Moving the cursor to a differential coefcient displays “dy/dx” in the top line, which
indicates differential.
If you manually entered values to the previous table that you still want displayed, you can re-enter
them here, then press l to see the graph of that table.
To generate a differential number table, press Lp to enter the SET UP menu for the TABLE
icon and N to Derivative, select q(On), then d.
6. For this example, enter YI: 3x
2
- 2 and Y2: x
2
. Press u(TABL) to view the differential number
table.
5. To see a split screen of your table and graph, press Lp to enter the SET UP menu for the
TABLE icon. Scroll down to Dual Screen, select q(T + G), d, then u(TABL).
TABLE

 Loading...


