CASIO
PROGRAM SHEET
Program for
Regression curve
No.
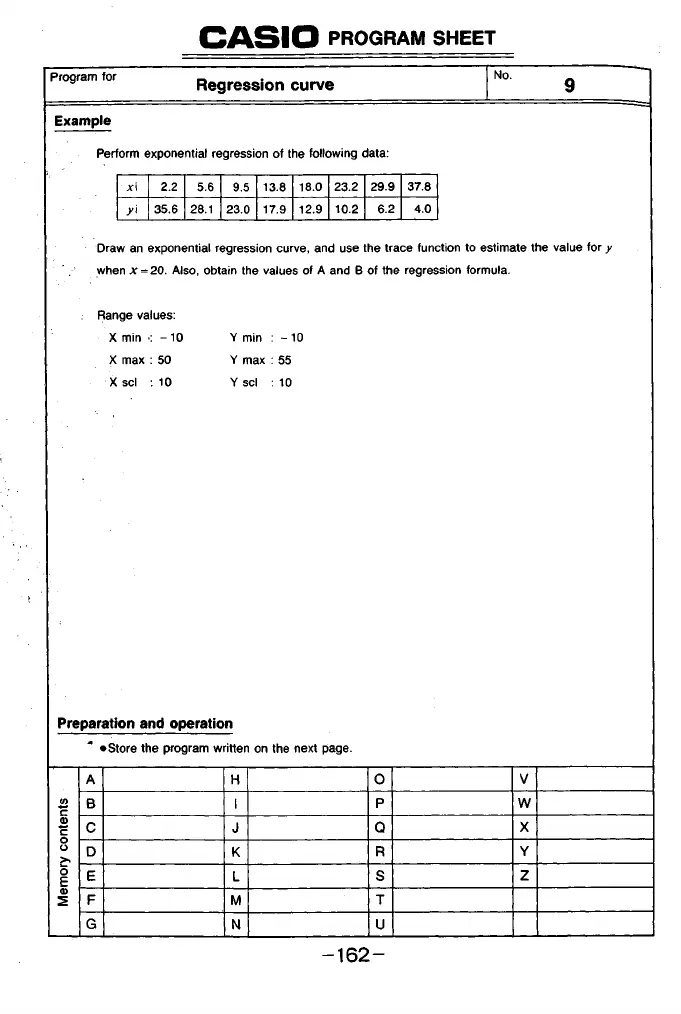
Example
Perform exponential regression of the following data:
x\ 2.2
5.6
9.5 13.8
18.0 23.2
29.9 37.8
y i
35.6 28.1 23.0 17.9
12.9 10.2 6.2 4.0
Draw an exponential regression curve, and use the trace function to estimate the value for y
when x = 20. Also, obtain the values of A and B of the regression formula.
Range values:
X min • - 1 0 Y min
-1 0
X
max 50 Y max
55
X scl 10
Y
scl 10
Preparation and operation
• Store the program written on the next page.
Memory contents
A H O
V
B
I
P w
C
J Q
X
D
K
R
Y
E
L S
z
F
M
T
G
N U
- 1 6 2 -