Graph
function
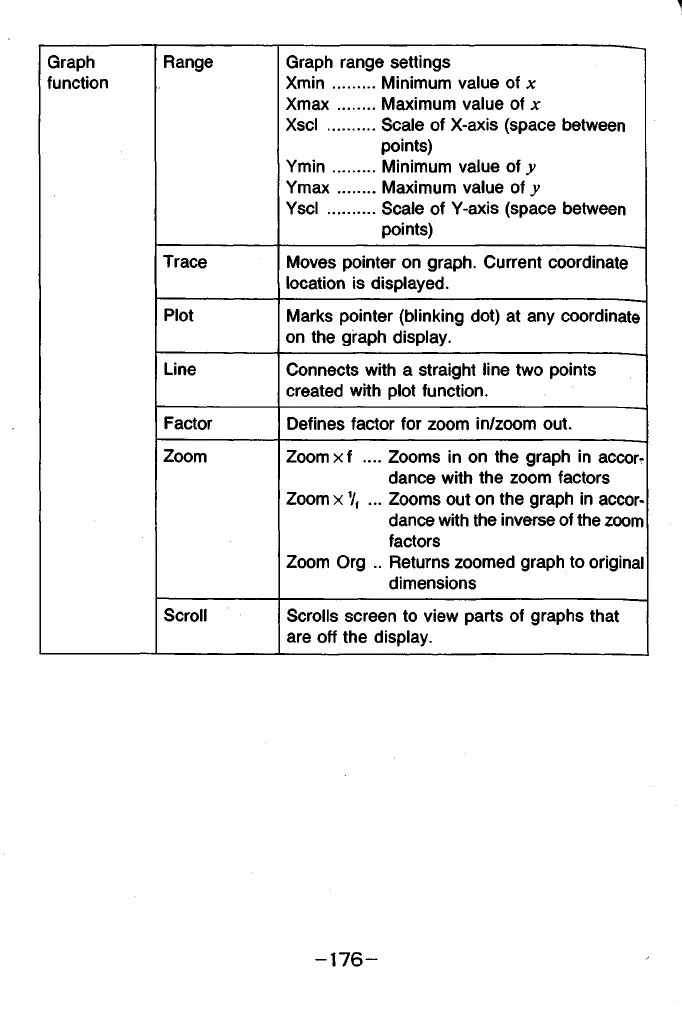
Range Graph range settings
Xm in
........
Minimum value of x
Xmax
......
Maximum value of x
Xscl
.........
Scale of X-axis (space between
points)
Ym in
........
Minimum value of y
Ymax
.......
Maximum value of y
Yscl
..........
Scale of Y-axis (space between
points)
Trace
Moves pointer on graph. Current coordinate
location is displayed.
Plot
Marks pointer (blinking dot) at any coordinate
on the graph display.
Line
Connects with a straight line two points
created with plot function.
Factor
Defines factor for zoom in/zoom out.
Zoom
Zoomxf .... Zooms in on the graph in accor
dance with the zoom factors
Zoom x 1/f ... Zooms out on the graph in accor
dance with the inverse of the zoom
factors
Zoom Org .. Returns zoomed graph to original
dimensions
Scroll
Scrolls screen to view parts of graphs that
are off the display.