If you did not name the sessions, they will be listed as Untitled. Click on a location to view your data. Lakebook will
show both sonar scans - on the bottom of the screen- and bathymetric mapping data – shown on the map.
Bathymetry will only be shown if the scan was made in Boat Mode or Onshore GPS Mode.
You will see that your maps and scans are grouped by location (all scans are grouped by the water body ).
Once you have selected the location and sessions you want, you are ready to start analyzing them. What you see
on screen will vary depending on the fishing mode you used for scanning at that location:
- For Standard Mode and Ice Fishing Mode, you will see a split screen. On the top half there is a map with pins
marking the different locations where you scanned. The bottom half shows the scans themselves.
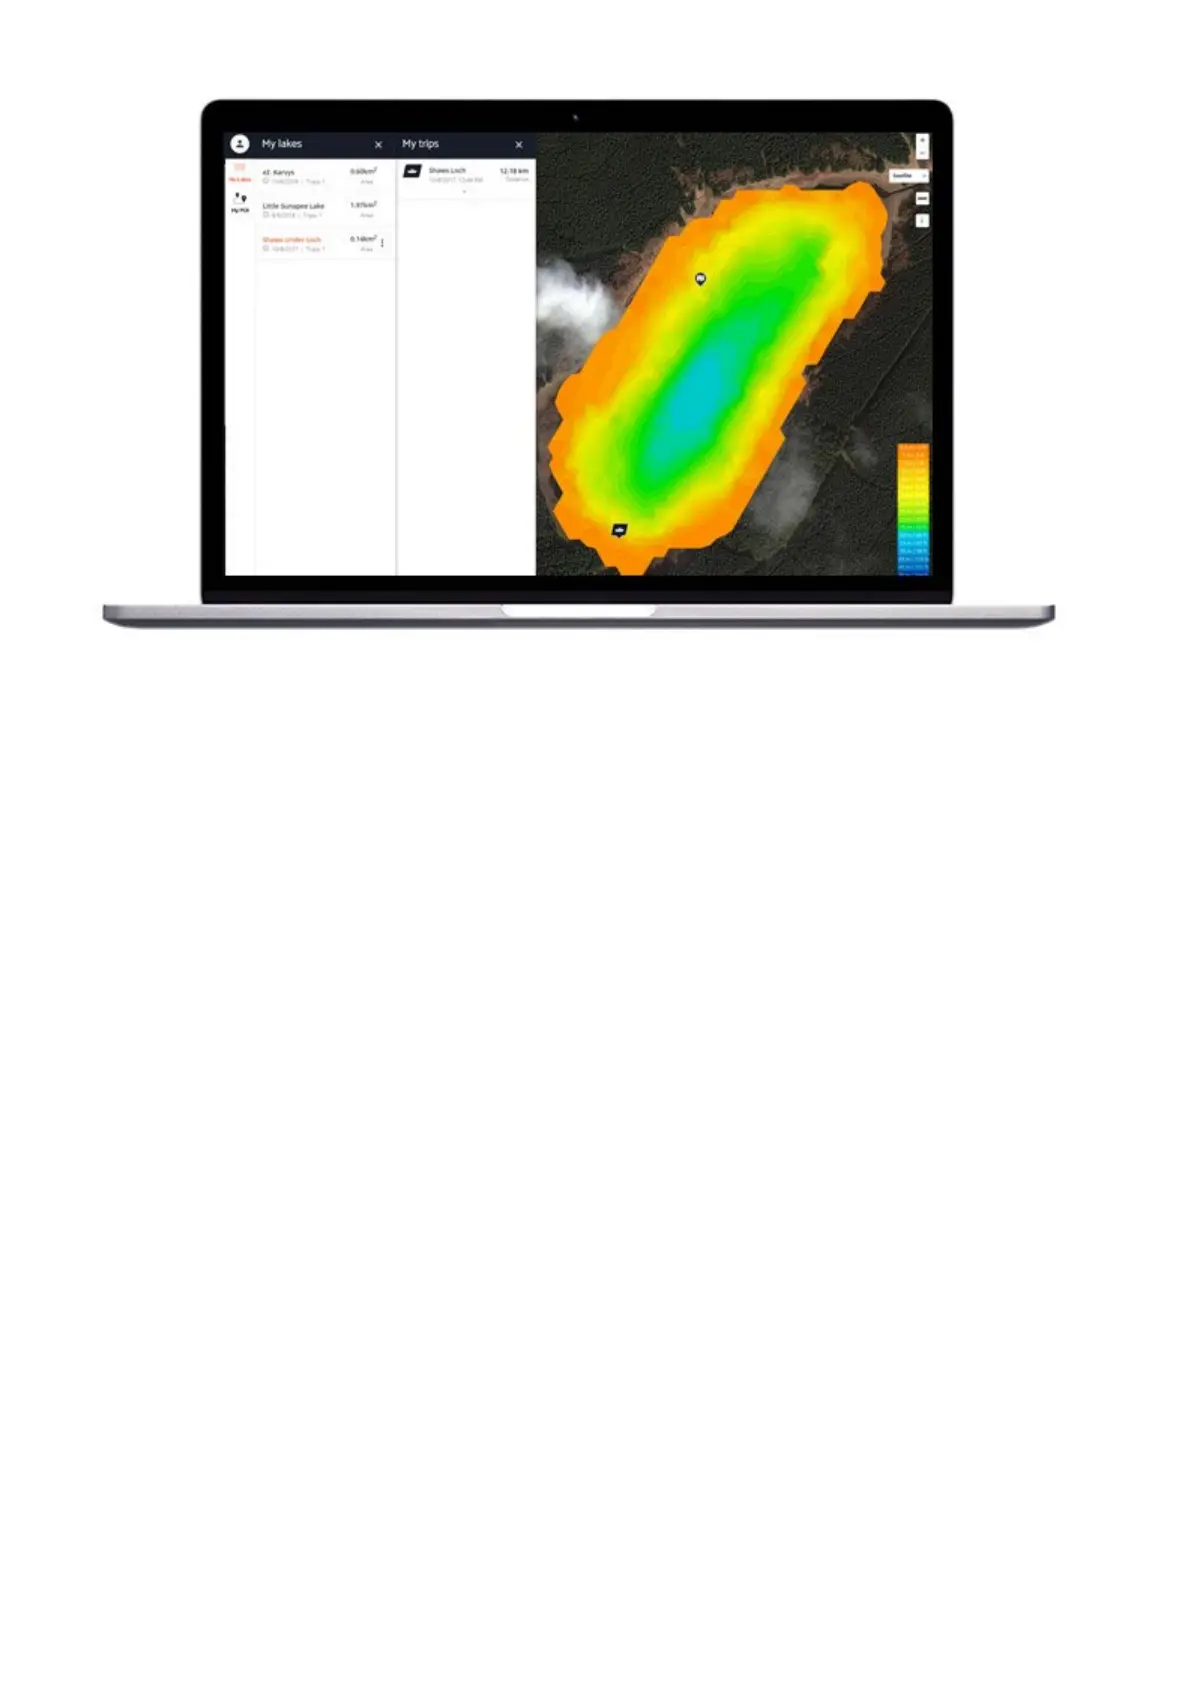
- For Boat Mode and Onshore GPS, you also see a split screen. This time the Bathymetric map you created is
shown on the top half, and the scans that were recorded while you were mapping are shown on the bottom half.
Scrolling your scans
You can scroll through your scans from right to left. Use the scroll bar at the bottom of the screen or click on the
scan and move your mouse.
For scans made using Boat Mode and Onshore GPS mode, you will notice that an arrow icon is shown on the map
itself. This icon shows where the scanning data you are looking at now was made. As you scroll through your scan,
the icon will move on the map. This enables you to locate exact points on the map where you marked a fish or
located some good structure. You can also click on a particularly interesting point on the bathymetric map and see
the sonar scan in that precise area.
You also have the option to add or remove fish icons from your scans.
Instant depth and GPS data
 Loading...