Dytran Instruments, Inc. 21592 Marilla St. Chatsworth, CA 91311 Phone: (818) 700-7818 Website: www.dytran.com email: info@dytran.com
Page | 9
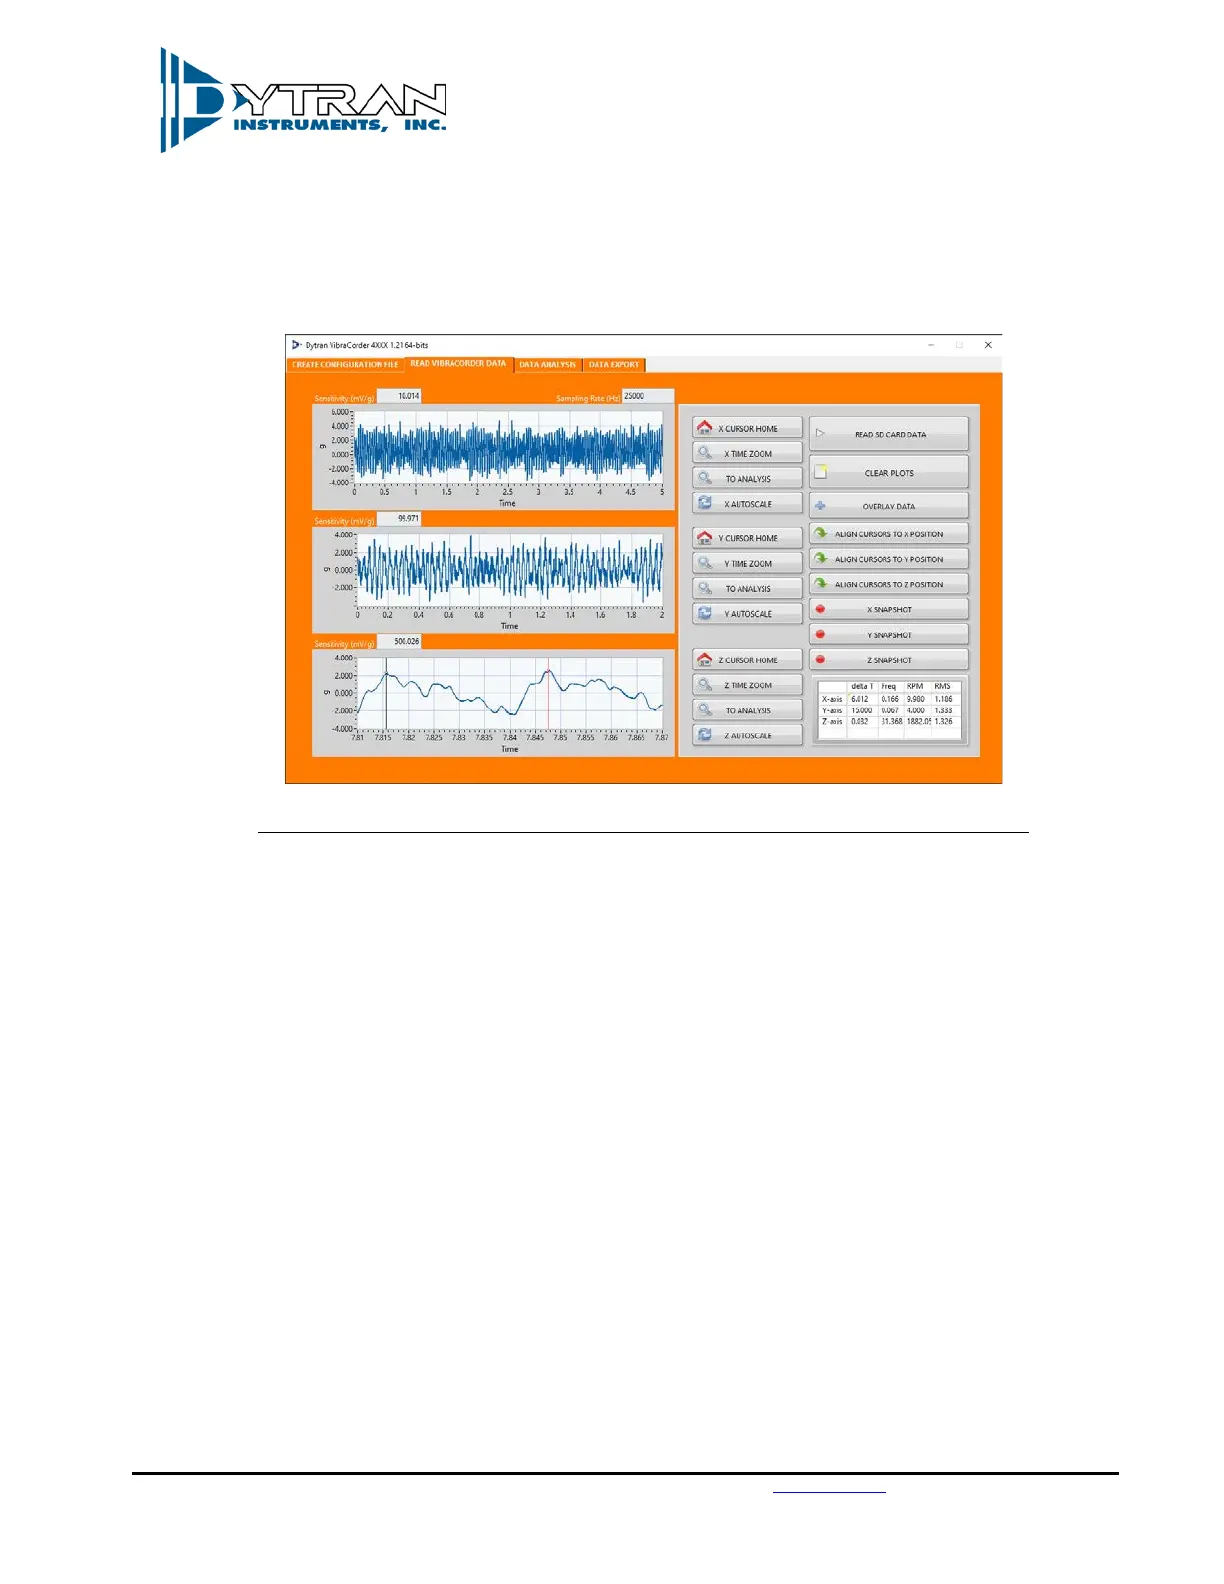
6.6 The data table below shows the immediate cursor information for each axis: delta T, Frequency
(Calculated based on cursor positions when they are located on one period), RPM (Calculated based
on cursor positions when they are located on one period), and RMS value of the signal between cursors.
See Figure 10 for example:
Figure 9: Channel three data of 1882 RPM (31.4 Hz) Engine Vibration at 1.326 g RMS.
6.7 “CLEAR PLOTS” button will clear all the data from the plots.
7. By pressing “TO ANALYSIS” button from any axis, the currently selected data between the cursors will
be exported to the “DATA ANALYSIS” tab with corresponding data from other two axes.
7.1 The software will prompt the user to either append a data set or create a new one. This feature
allows data split between two files to be combined. When Append is selected, the new trace will
be added at the end of the old trace. When New is selected, all the previously displayed data shall
be erased and substituted with the newly imported data set.
7.2 “RELOAD SELECTED DATA” button shall reload the original set of data into the analysis window.
7.3 “LOW PASS FILTER” and “HIGH PASS FILTER” buttons shall apply specified filter to the data, user
shall be prompted for corner frequency and filter order. Butterworth topology is used.
7.4 “SINGLE INTEGRATION” and “DOUBLE INTEGRATION” buttons will apply either single or double
numerical integration. The software shall automatically apply a high pass filter before performing
integration (to avoid any data run off). User shall be prompted for corner frequency of the filter.
7.5 “OVERSAMPLING” button shall perform non-linear interpolation on the data set, calculating
additional data point in between the existing one. The user will be prompted for the oversampling
frequency: