Echometer Company Model – M Manual Phone: (940) 767-4334
5001 Ditto Lane Page 39 Fax: (940) 723-7507
Wichita Falls, Texas 76302, U.S.A. E-Mail: info@echometer.com
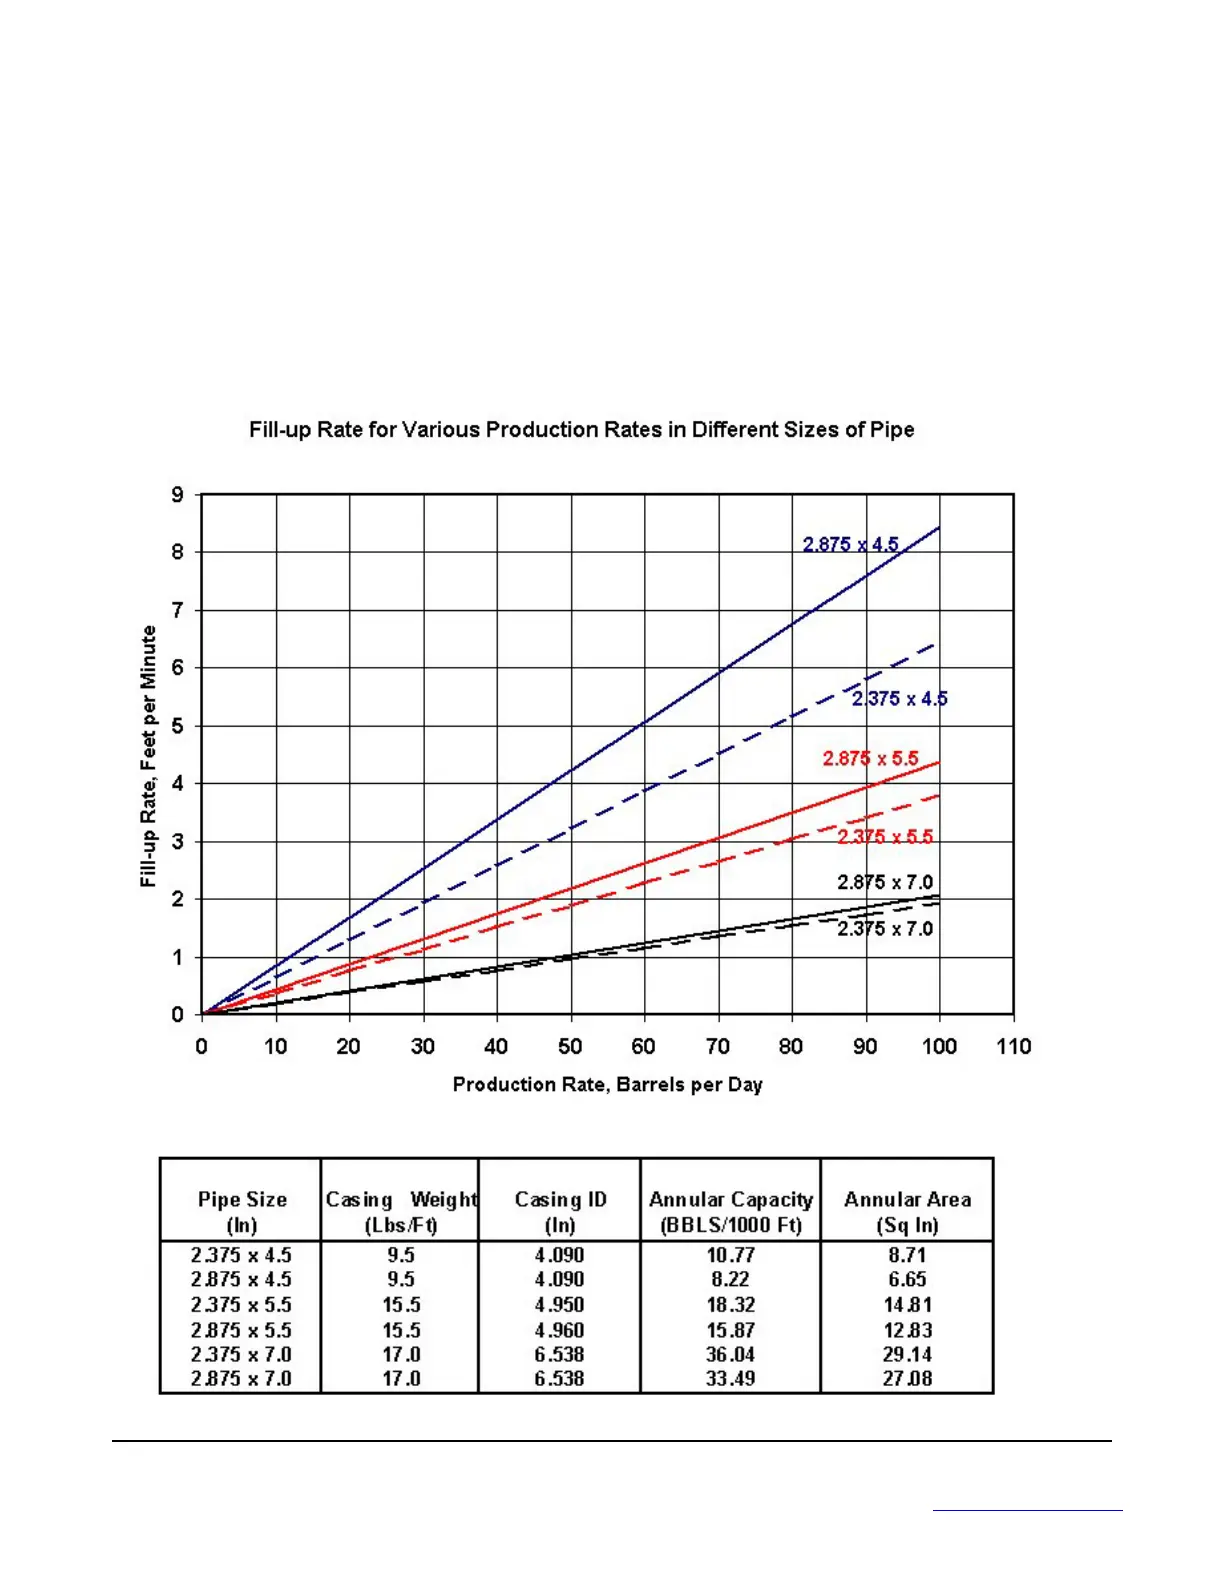
Rate of Fill-up Graph
The accompanying graph is very useful in liquid level work. The graph indicates the initial rate of fill-up between casing
and tubing in a well for a certain producing rate after the well is shut-in. The chart is read as follows: If the well produces
less than 100 BPD, find the point on the bottom scales corresponding to the producing rate, read straight up until
intersecting the line indicating the pipe sizes, then read to the left to find fill-up rate. For over 100 BPD, find the point on
the bottom scale corresponding to 1/10 of the producing rate, read up until intersecting the line indicating the pipe sizes,
then read to the left to find fill-up rate and multiply by 10. For example, if a well which has 2” tubing and 5
1
/
2
” casing is
producing 60 BPD, the initial fill-up rate is 2.2 feet per minute. A well with 2
1
/
2
” tubing and 4
1
/
2
” casing, producing at 700
BPD will have an initial fill-up rate of 59 feet per minute.