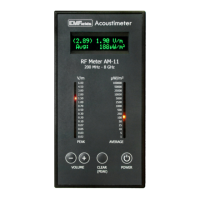
The Acoustimeter calculates the average
power in the measured RF by an analysis of
the waveform. The average power is shown
on the LEDs and on the LCD display.
The LED points on each of the scales are
approximately equivalent across the two
columns of LEDs for continuous wave (CW)
signals. The more pulsatile the signal is, the
higher the peak scale will read in
comparison to the average power scale.
The EMFields website has an RF unit
converter for CW signals on this page:
http://www.emfields-solutions.com/rf
What do the LED colours mean?
Our peak signal strength scale is coloured
based on the levels that electrosensitive
people report as adversely affecting their
health.
Below 0.05 volts per metre (V/m), few
people report ill-effects, so these are green.
Between 0.05 and 0.5 V/m, some
individuals report ill-effects, so these are
yellow. Above 0.5 V/m, nearly all sensitive
individuals report experiencing adverse
health effects, so these are red.
The average power density scale LEDs are
all orange in colour.