Hexylon High-performance portable meter
58
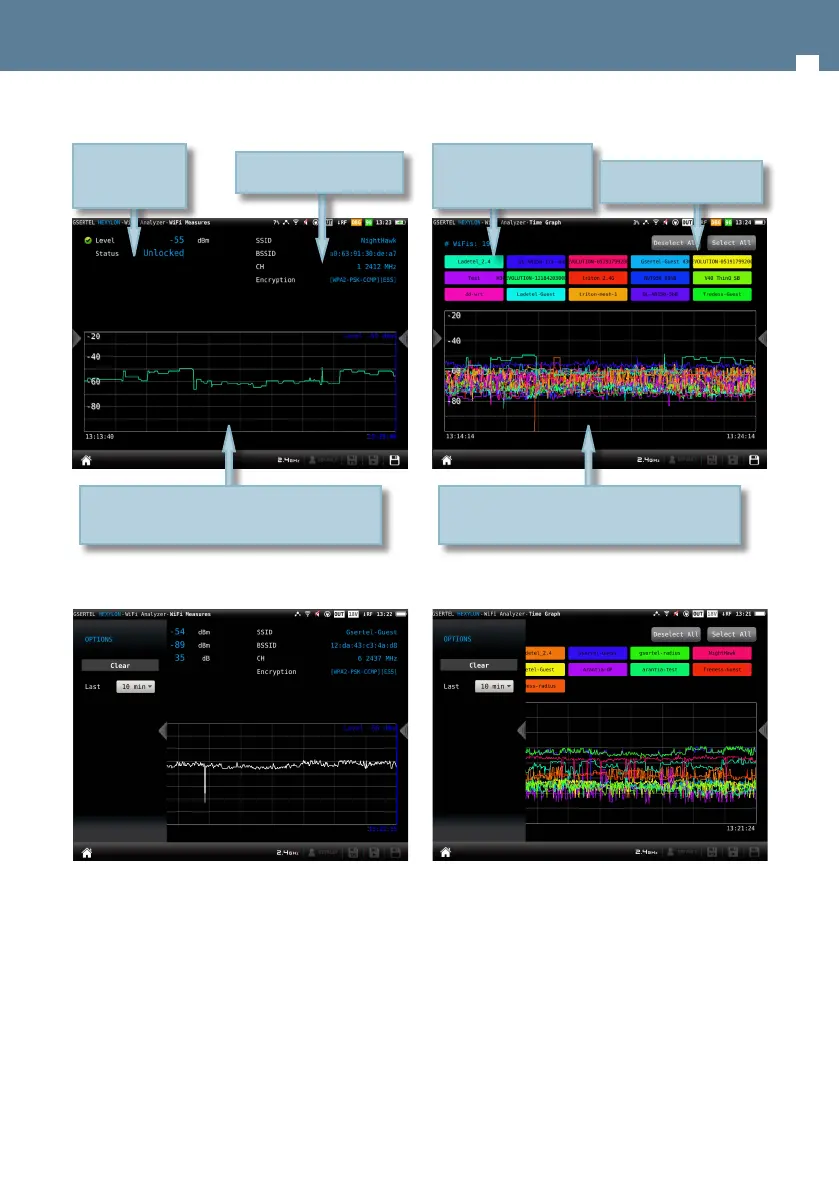
10.2.1.1.- Main window
9.2.1.2.- Contextual options menu
• Clear: resets the chart.
• Last: 10 min, ½ hour, ½ day, 1 day, 1 week. Allows
you to select the time interval shown in the chart.
9.2.3- Time graph
This feature shows a graph with the level
measuremet historical of all the Wi-Fi networks
detected by the HEXYLON.
Level measurement historial during a time interval
selected by the user.
Drag to move the blue marker
Status and level
measurement
Wi-Fi network parameters
9.2.3.1.- Main window
10.2.3.2.- Contextual options menu
• Clear: resets the graph.
• Last: 10 min, ½ hour, ½ day, 1 day, 1 week. Allows
select the time interval shown in the graph.
9.2.4- Channel map
This feature shows a graph with the distribution of
all the Wi-Fi networks detected by the HEXYLON.
When this feature is maximized, the user can select
a Wi-Fi using the “up” and “down” arrow buttons of
History of the level measurement during an
interval selected by the user
You can select the Wi-Fi
networks that you want to
see in the graph
Select/unselect all the
networks
 Loading...