outd oor te m p .
D B /W B
15
20 25
-15
138 8 149 5 163 3
-5
166 5 164 4 198 6
5
187 9 213 5 226 3
7/6
151 4 166 8 182 1
15
703 771 838
20
464 483 525
25
466 488 527
ind oor tem p.(hum idity 46% )
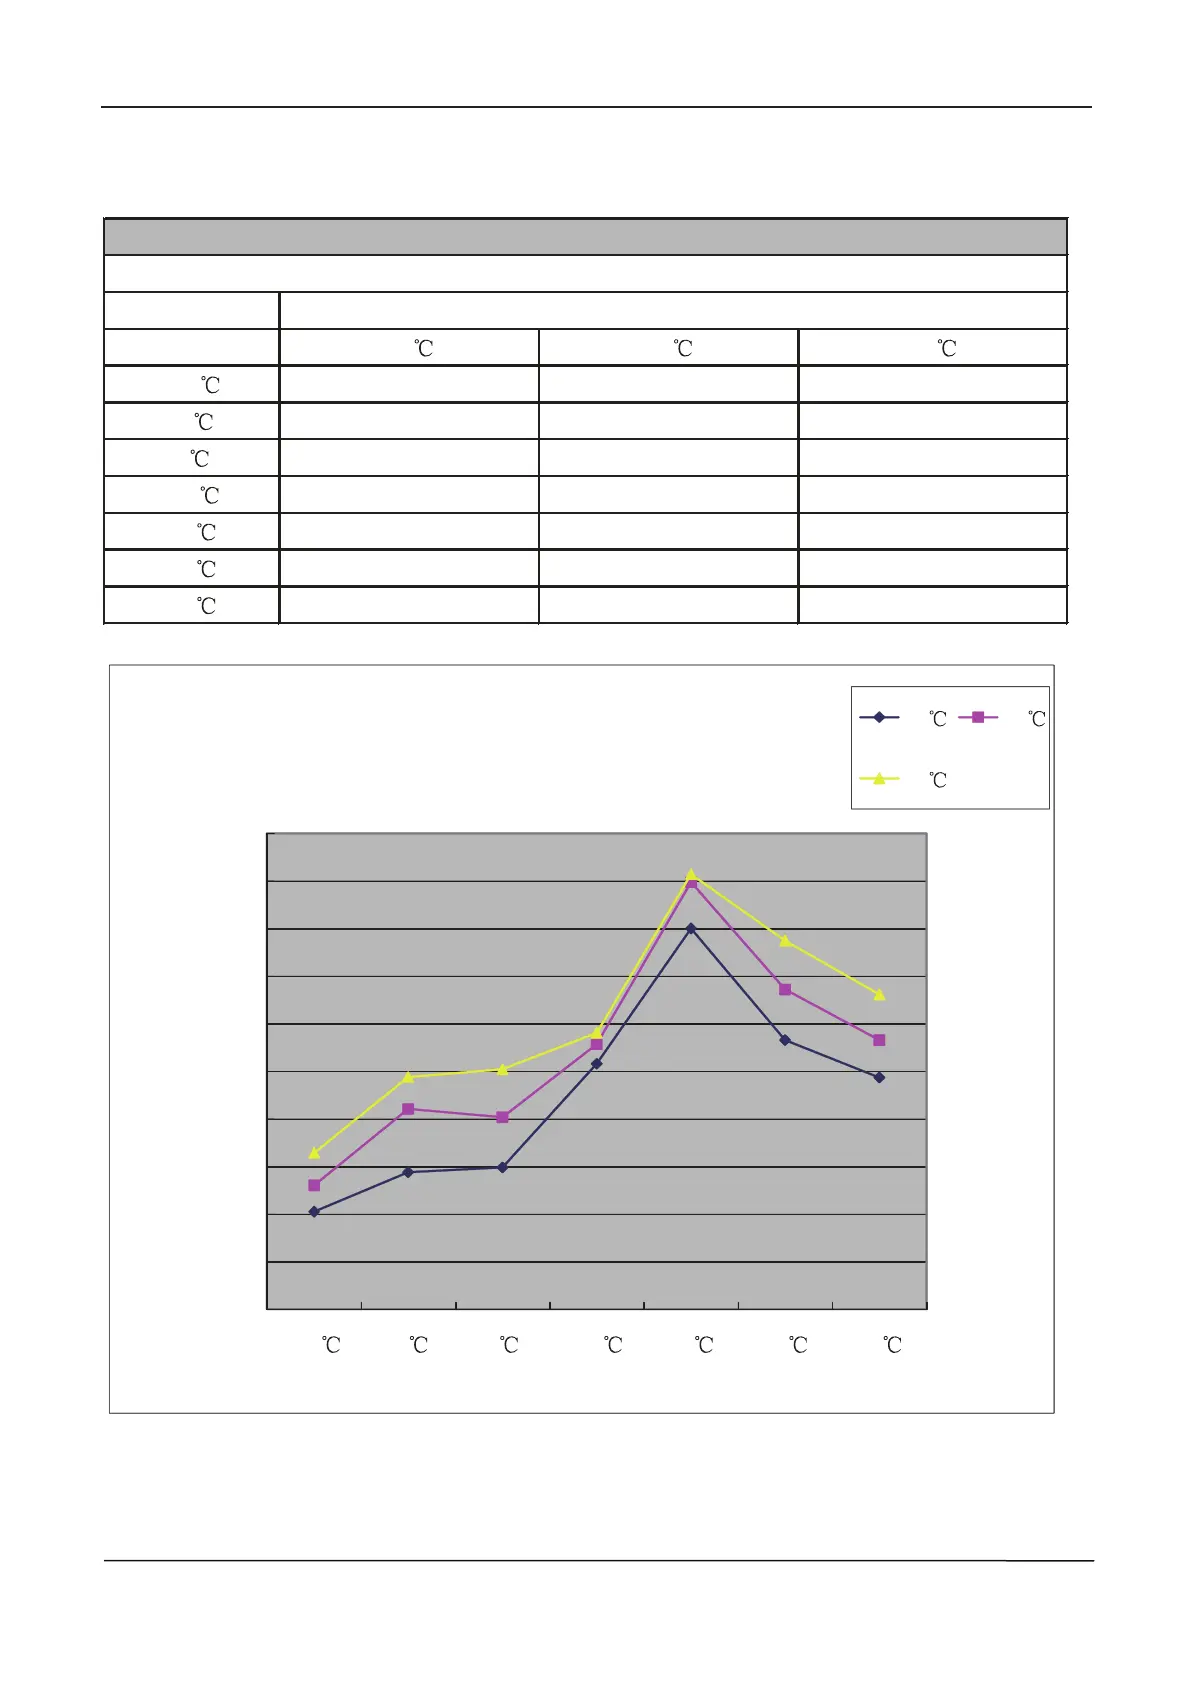
power consumption value-temp.table
(12+12)performancecurves
conoling capacity(w)
800
900
100 0
110 0
120 0
130 0
140 0
150 0
160 0
170 0
180 0
-15
-5 5 7/6
20 25
co oling cap acity(w )
indo or tem pe .(D B /W B )
hea ting capacity and indo or/ou tdoo r tem p.curves
15 20
25
11.4 heating power consumption-temp.curves
Performance curves diagram
Domestic air conditioner
52
 Loading...