-3- -4-
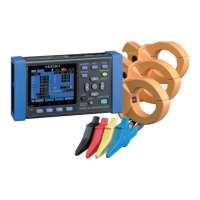
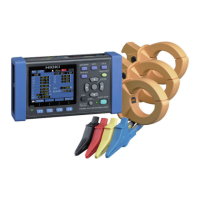
5 Connecting the clamp sensors to the measurement lines
When the measured value is shown as 0 A
The zero-display processing (which forces the display to
read “0 A” when the reading is 0.4% of the range) may
cause the display to read “0 A.” Try using a lower current
range as described in the following step.
See: Instruction manual “2.6 Turning the Power On/Off”
1
Check the wiring
diagram.
When using 9660 sensor
Clamp 1 conductor only.
Hint
Example: Zero-display processing
With the 500 A range
Display will read “0 A” when the measured
value is 2 A (0.4% of 500 A) or less.
3
Verify that
measured values
are being displayed.
Point the arrow toward the load side.
OK
3
1
4
4
Press the
“Next” key.
2
Connect the clamp
sensors to the sec-
ondary side of the
breaker.
Power supply side
Load side
Current
direction
mark
2
Apply the clamps to the
measurement lines.
PROHIBITED
Move the cursor to item.
Press the “Enter” key.
Check key points and correct the wiring.
6 Setting the current range
Select an appropriate range based on factors such as the rated load, operat-
ing state, and breaker rating. When the range is too low, an over-range event
will occur during measurement, preventing accurate measurement. When the
range is too high, the magnitude of the error component will increase, prevent-
ing accurate measurement. Set the current range based on your expectation
of the maximum load current that will flow during the measurement period.
7 Checking the clamp sensor (current) wiring
Hint
2
Verify the results of checking the
wiring.
If a result is
1
2
3
Is the value low? If the value is lower
than 0.5, the instrument may be
wired incorrectly. Check the wiring.
55 A (110% f.s.) 11 A (110% f.s.)
0A 0A
50 A range 10 A range
Over-range
Is the value negative?
Check the wiring.
1
Check measured values.
Example
If all results are , or if you check the
wiring because is displayed but
find no problems
1
Set the range.
Effective measure-
ment range
(Guaranteed accu-
racy range)
65 A (130% f.s.)
Display range
13 A (130% f.s.)
In this example,
the instrument is
set to 50 A.
Voltage phase
Voltage phase
Current phase
Current phase
PASS range
PASS range
2
Press the
“Next” key.
3
Press the “Next” key.
1
2
3
1
2
If the available save time is shorter than the measurement period, the following methods can
be used to increase the available save time:
• Increase the save interval.
• If there is any unnecessary data on the SD memory card, delete it or reformat the card.
(Exit the Quick Set and access the File screen.)
Hint
1
2
3
4
5
6
7
8
9
10
11
12
With the save interval
set to 5 min.
Recording
Recording
Recording
Start recording
Recording
Recording
Verify that the value is longer than the period for
which you wish to perform measurement.
(The maximum data storage time is one year.)
PW3360-20 Average only
PW3360-21 Average only (no harmonics)
Rec. start method:
Interval time
Example
8 Recording settings
Configure the settings as the following screen, and then press the "NEXT" key.
9 Checking settings and starting recording
• The auto power-off function will cause the
screen to turn off, but recording will con-
tinue (the Recording and Power LEDs will
stay on).
• Press the key to display the Setting
Confirmation screen, which allows you to
check key recording and setting informa-
tion on a single screen.
If you wish to close the window,
press any key. The standby state
will continue.
Hint
Data will be saved to the SD
card for each save interval.
Check the settings.
1
Press the key.
The instrument will enter the standby state.
Recording will start at a well-defined time.
2
1
2
3
4
5
6
7
8
9
10
11
12
Recording
Recording
Start recording
Recording
Recording
Recording
See: Instruction manual
“Chapter 6 Starting and Stopping
Recording and Measurement”
Recording LED flashing
Recording LED on
Stand by for recording.
10 Stopping recording
Saved data can be loaded onto a computer and analyzed using the
SF1001 Power Logger Viewer (optional) or an application such as
Spreadsheet software. For more information, see the instruction
manual. (Harmonic data is saved in a binary format and can only be
analyzed by the SF101 Power Logger Viewer.)
See: Instruction manual “9.2 SF1001SF1001 Power Logger Viewer
(Optional)”
Hint
Disconnect the wires.
1
Turn off the instrument.
2
11 After measurement is complete
Disconnect the cables
from the instrument.
3
Remove the SD
memory card.
5
4
Disconnect the
AC adapter.
Press the key.
The Rec Stop dialog will be displayed.
1
Press the “Enter” key.
Recording LED off
1
2
3
2
2
4
5
3
1
 Loading...