3
25
• After the scale completes the calculations, the display will show the data
below twice, in the following order:
FAT
TBW
MUS
BONE
BMI
KCAL
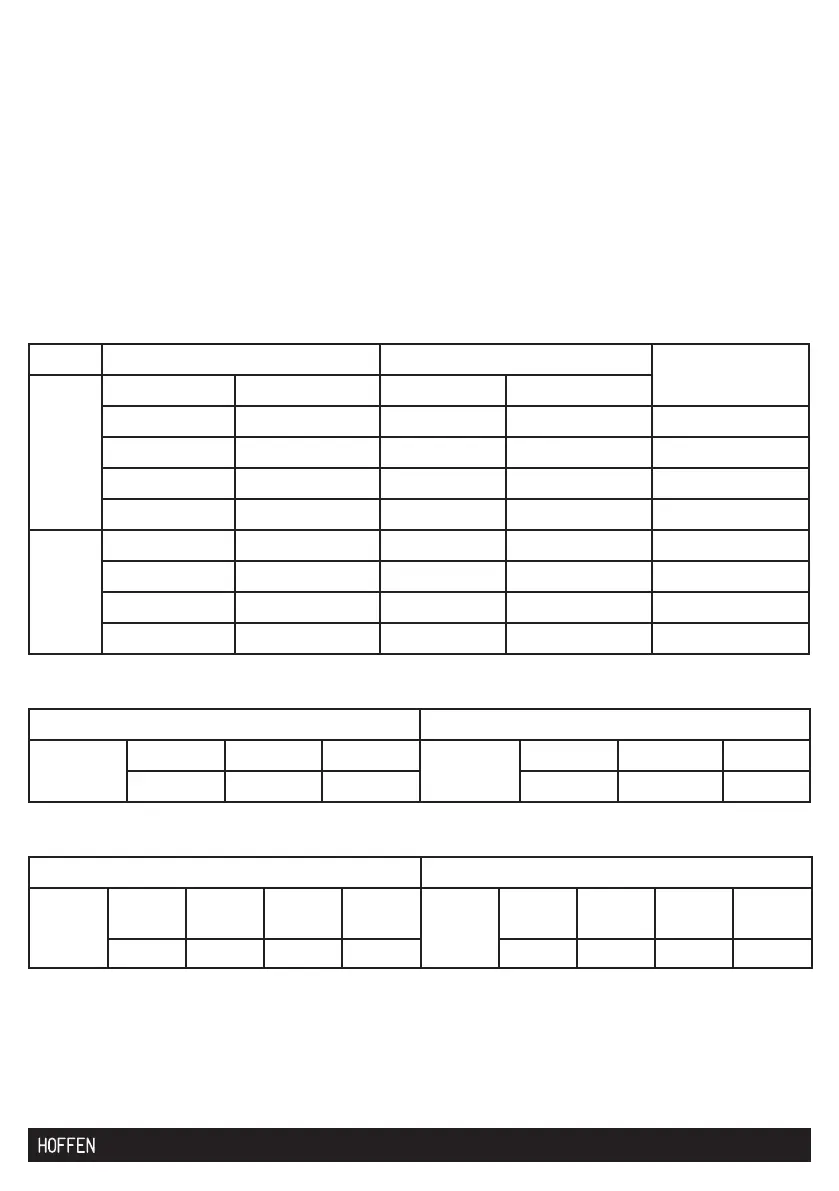
7.5 Tables of results
Fat content
Age Female Male
Result
≤30 Fat content Water content Fat content Water content
4.0-20.5 66.0-54.7 4.0-15.5 66.0-58.1 Underweight
20.6-25.0 54.6-51.6 15.6-20.0 58.0-55.0 Normal weight
25.1-30.5 51.5-47.8 20.1-24.5 54.9-51.9 Overweight
30.6-50.0 47.7-34.4 24.6-50.0 51.8-34.4 Obese
>30 4.0-20.5 66.0-54.7 4.0-15.5 66.0-58.1 Underweight
20.6-25.0 54.6-51.6 15.6-20.0 58.0-55.0 Normal weight
25.1-30.5 51.5-47.8 20.1-24.5 54.9-51.9 Overweight
30.6-50.0 47.7-34.4 24.6-50.0 51.8-34.4 Obese
Body fat percentage
Bones (KG) Bones (KG)
Female <39 kg 40-60 kg >60 kg Male <54 kg 55-75 kg >75 kg
1,7 2,1 2,4 2,4 2,8 3,1
Muscle mass percentage
Muscles % Muscles %
Female Under-
weight
Nor-
mal
Over-
weight
Obese
Male
Under-
weight
Nor-
mal
Over-
weight
Obese
<25% 25-27% 28-29% >30% <30% 31-34% 35-38% >39%