Section IV
Model
339
A
TUNEABLE
NOTCH
FILTER
(
hp-
Model 339A)
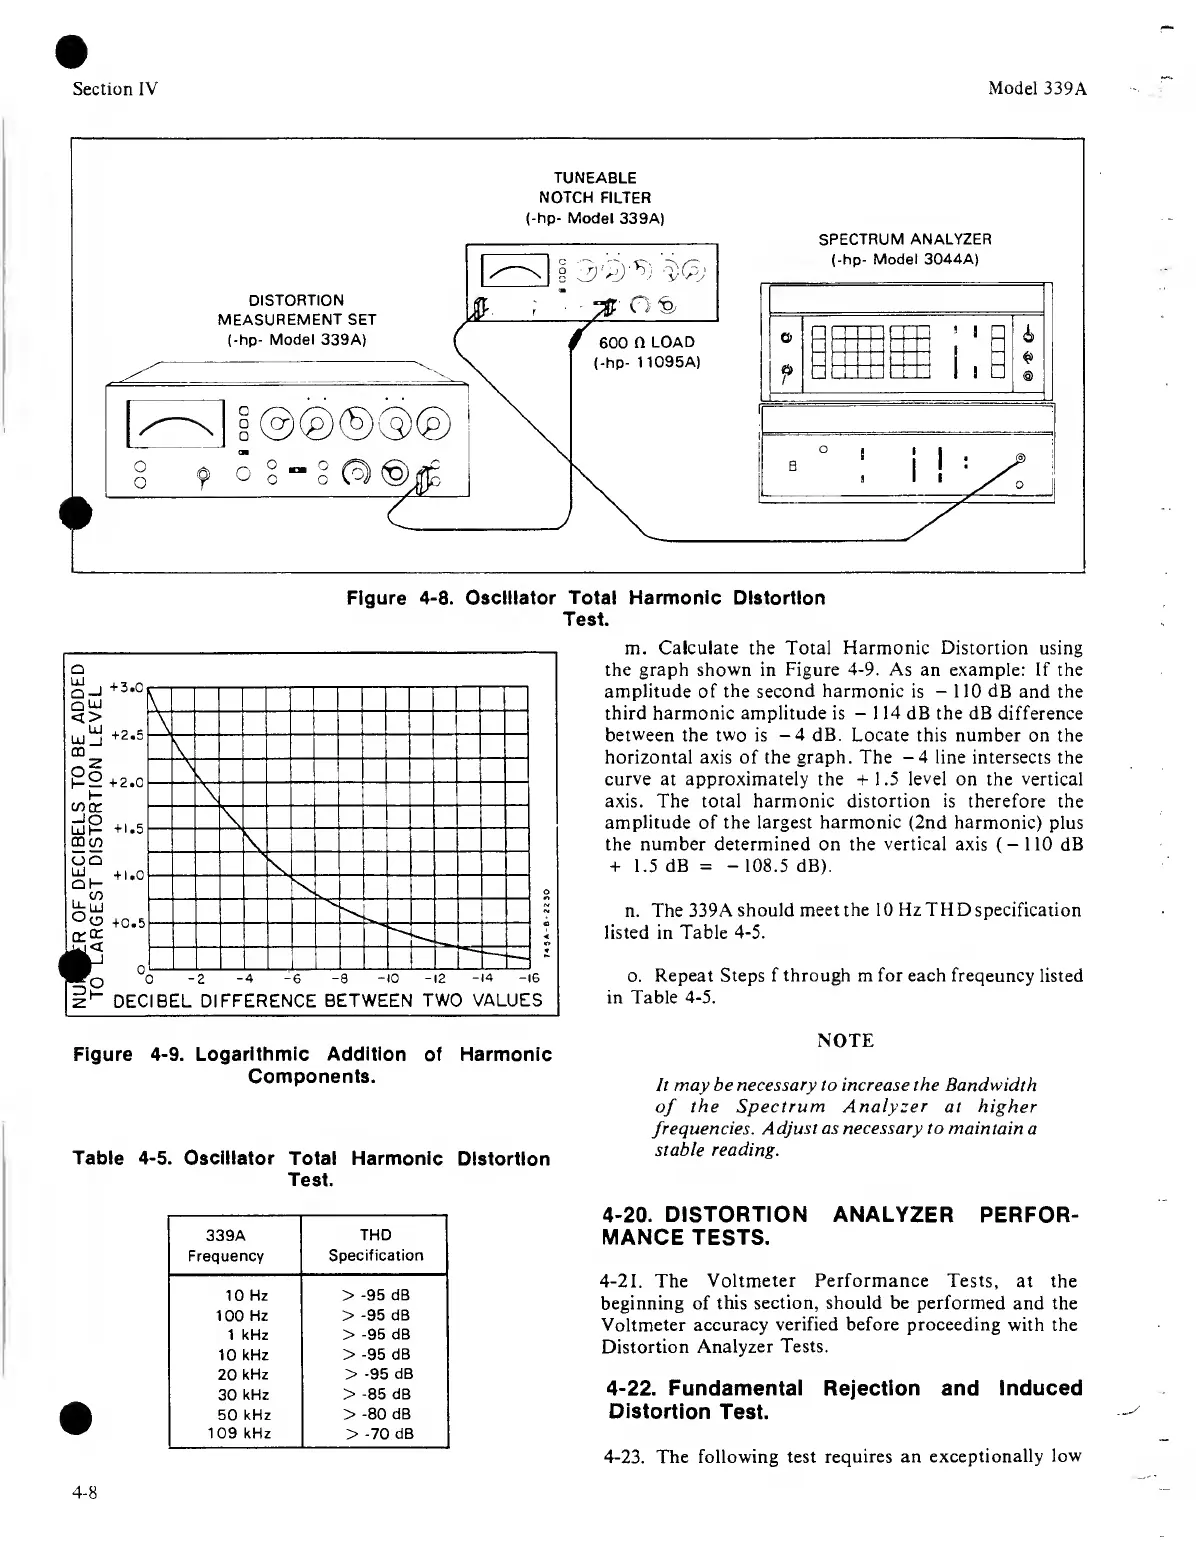
Figure
4-8.
Oscillator
Total Harmonic
Distortion
Test.
Figure
4-9.
Logarithmic Addition
of Harmonic
Components.
Table
4-5.
Oscillator
Total Harmonic
Distortion
Test.
m. Calculate the Total
Harmonic
Distortion using
the graph shown in Figure
4-9.
As an example: If the
amplitude
of
the
second
harmonic
is
—
110 dB
and
the
third harmonic amplitude
is
-
1
14
dB the dB difference
between the two
is
-4
dB. Locate this number
on the
horizontal axis
of
the graph. The
-4
line
intersects the
curve
at
approximately
the
+1.5 level
on the
vertical
axis. The total
harmonic distortion is
therefore the
amplitude of the largest harmonic (2nd harmonic)
plus
the
number determined
on the
vertical
axis
(-110
dB
+ 1.5 dB
= -
108.5
dB).
n. The 339A
should meet the 10 Hz THD specification
listed in Table
4-5.
o.
Repeat Steps f through m for each freqeuncy
listed
in Table
4-5.
NOTE
It may be
necessary
to increase the Bandwidth
of
the Spectrum
Analyzer
at higher
frequencies.
Adjust as necessary to maintain
a
stable reading.
339A
Frequency
THD
Specification
10 Hz >
-95
dB
100 Hz >
-95
dB
1 kHz >
-95
dB
10
kHz >
-95
dB
20
kHz >
-95
dB
30
kHz >
-85
dB
50 kHz
>
-80
dB
109
kHz
>
-70
dB
4-20.
DISTORTION ANALYZER
PERFOR-
MANCE
TESTS.
4-21.
The
Voltmeter Performance Tests,
at the
beginning of
this section, should be performed
and the
Voltmeter
accuracy verified before proceeding with
the
Distortion
Analyzer Tests.
4-22.
Fundamental Rejection and Induced
Distortion
Test.
4-23.
The following test
requires an
exceptionally
low
4-8
 Loading...