TStep controls smoothness
The effect of TRng
will be visible.
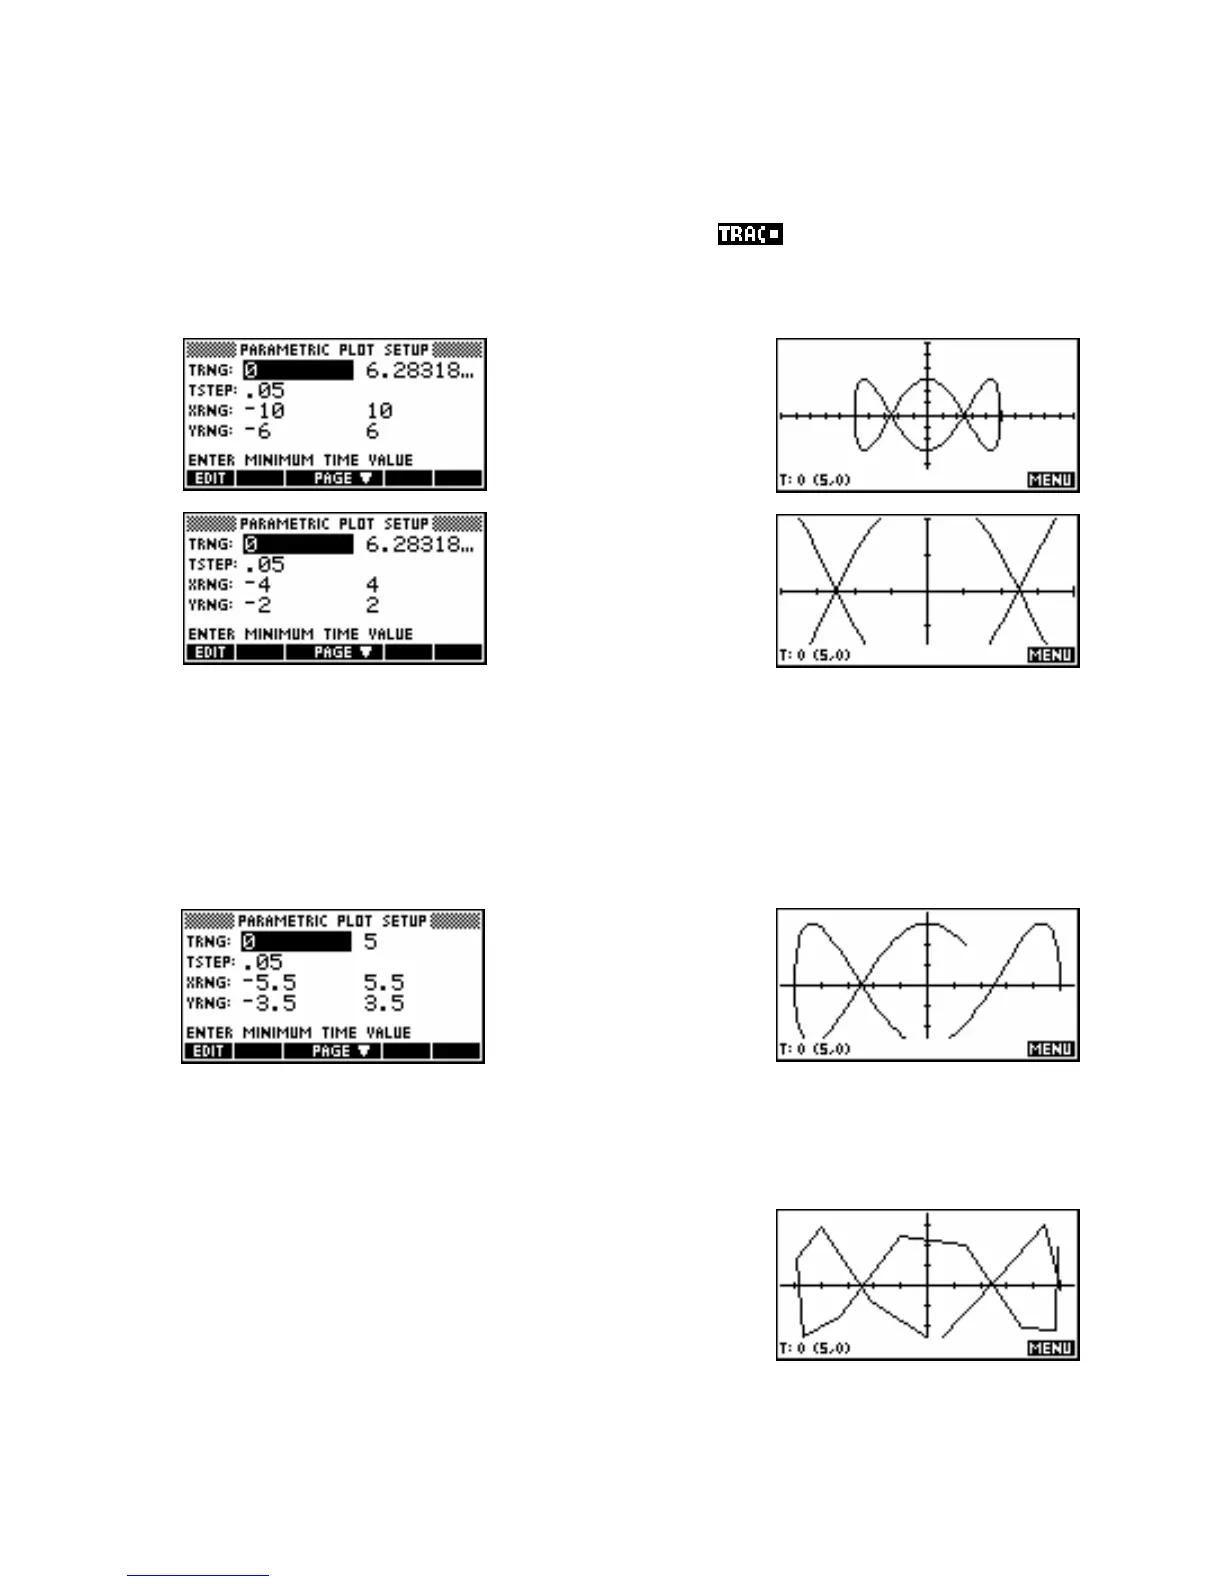
The X and Y ranges control the lengths of the axes. They determine how much of the function, when drawn,
See the examples below. Notice that in both cases,
is on and shows the T value,
followed by an ordered pair giving (X,Y).
gives a graph of:
whereas..
gives a graph of:
Unlike
XRng & YRng, the effect of TRng is to decide how much of the graph is drawn at all, not how much
is displayed of the total picture.
For example…
gives a graph of:
As you can see above, changing the T range from
0
t ≤ 2
to 0
t ≤ 5 gives a graph that appears only
partially drawn. Of course, what constitutes “fully drawn” depends on the function used.
The value of the parameter
TStep controls the jump between successive
values of
T when evaluating the function for graphing. Making TStep
too large will produces a graph which is not smooth. The example on
the right shows
TStep=0.5 instead of 0.05.
93

 Loading...