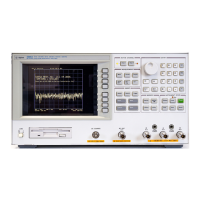
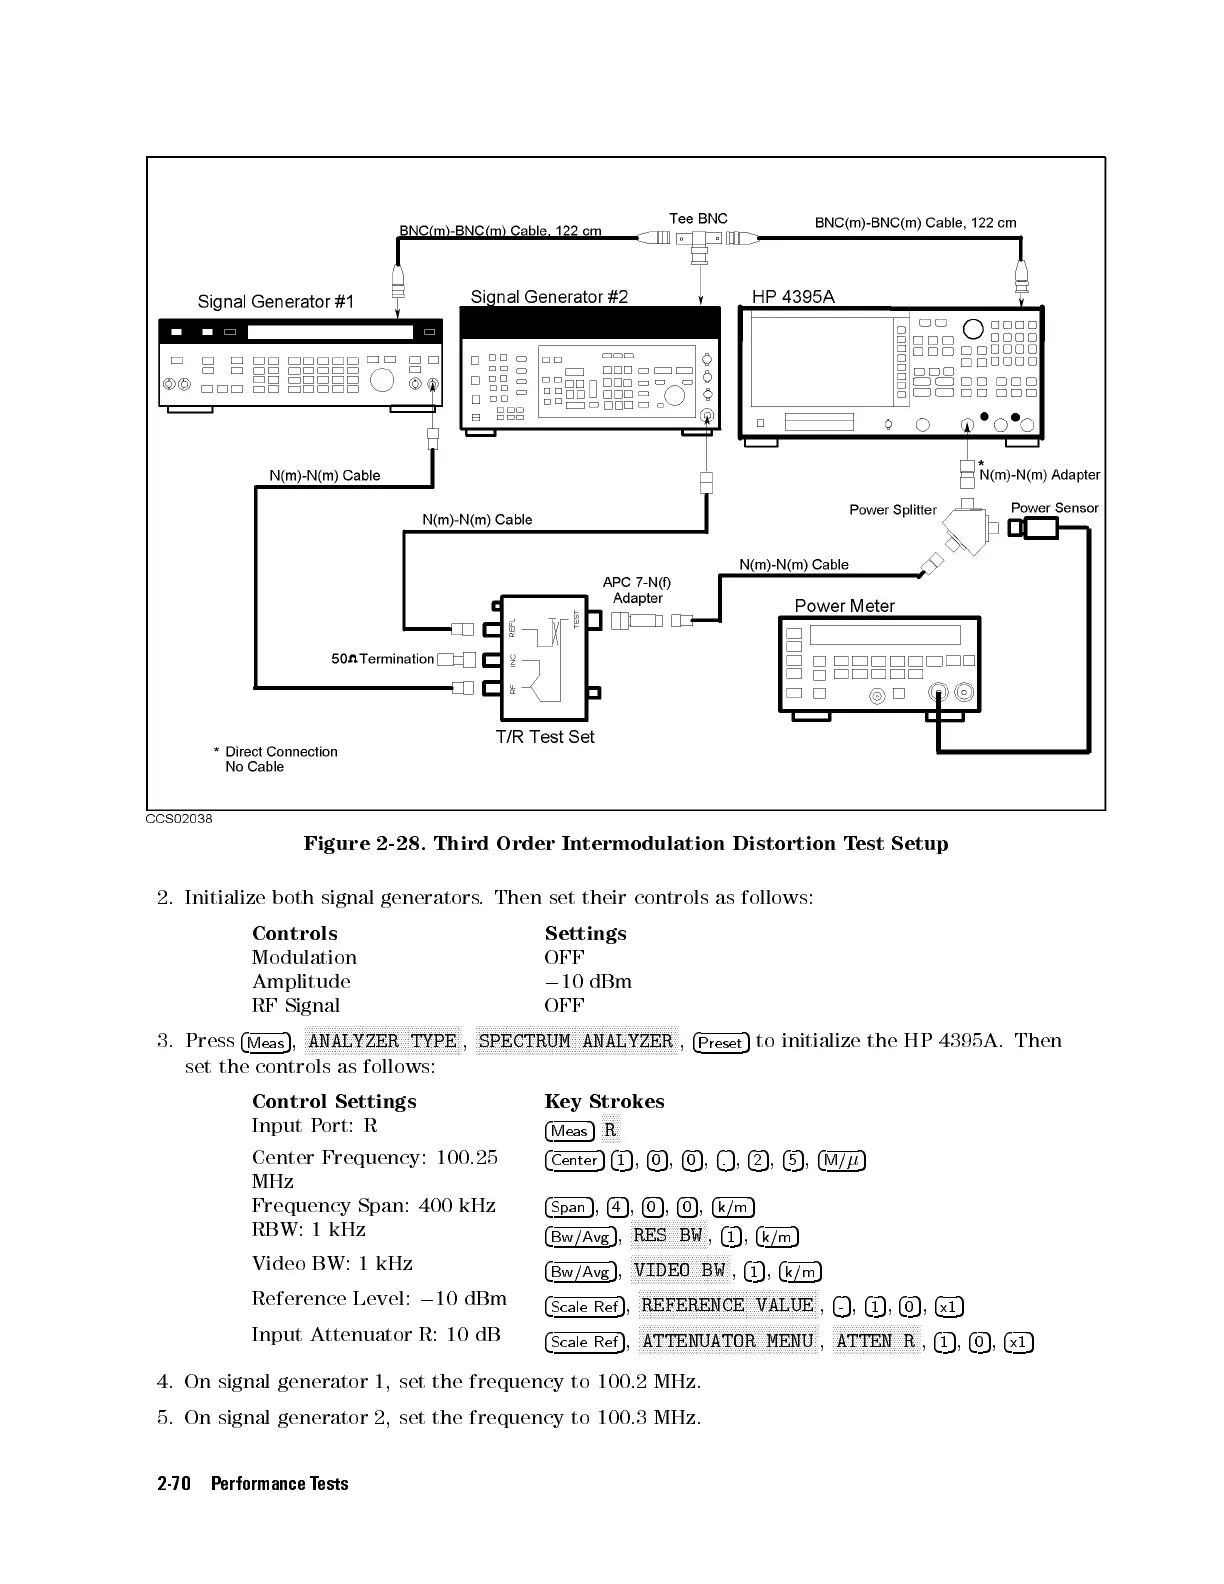
Figure 2-28. Third Order Intermodulation Distortion Test Setup
2. Initialize both signal generators. Then set their controls as follows:
Controls Settings
Modulation OFF
Amplitude
0
10 dBm
RF Signal OFF
3. Press
4
Meas
5
,
N
NNNNNNNNNNNNNNNNNNNNNNNNNNNNNNNNNNNNNNNN
ANALYZER TYPE
,
N
NNNNNNNNNNNNNNNNNNNNNNNNNNNNNNNNNNNNNNNNNNNNNNNNNNNN
SPECTRUM ANALYZER
,
4
Preset
5
to initialize the HP 4395A. Then
set the controls as follows:
Control Settings Key Strokes
Input Port: R
4
Meas
5
NNNNN
R
Center Frequency: 100.25
MHz
4
Center
54
1
5
,
4
0
5
,
4
0
5
,
4
.
5
,
4
2
5
,
4
5
5
,
4
M/
5
Frequency Span: 400 kHz
4
Span
5
,
4
4
5
,
4
0
5
,
4
0
5
,
4
k/m
5
RBW: 1 kHz
4
Bw/Avg
5
,
NNNNNNNNNNNNNNNNNNNN
RES BW
,
4
1
5
,
4
k/m
5
Video BW: 1 kHz
4
Bw/Avg
5
,
NNNNNNNNNNNNNNNNNNNNNNNNNN
VIDEO BW
,
4
1
5
,
4
k/m
5
Reference Level:
0
10 dBm
4
Scale Ref
5
,
NNNNNNNNNNNNNNNNNNNNNNNNNNNNNNNNNNNNNNNNNNNNNNN
REFERENCE VALUE
,
4
-
5
,
4
1
5
,
4
0
5
,
4
x1
5
Input Attenuator R: 10 dB
4
Scale Ref
5
,
NNNNNNNNNNNNNNNNNNNNNNNNNNNNNNNNNNNNNNNNNNNNNNN
ATTENUATOR MENU
,
NNNNNNNNNNNNNNNNNNNNNNN
ATTEN R
,
4
1
5
,
4
0
5
,
4
x1
5
4. On signal generator 1, set the frequency to 100.2 MHz.
5. On signal generator 2, set the frequency to 100.3 MHz.
2-70 Performance Tests
 Loading...