2.
Press
4
Meas
5
,
NNNNNNNNNNNNNNNNNNNNNNNNNNNNNNNNNNNNNNNNN
ANALYZER TYPE
,
NNNNNNNNNNNNNNNNNNNNNNNNNNNNNNNNNNNNNNNNNNNNNNNNNNNNN
SPECTRUM ANALYZER
,
4
Preset
5
to initialize the HP 4395A. Then
set the controls as follows:
Control Settings Key Strokes
Input Port: R
4
Meas
5
NNNNN
R
Frequency Span: 2.24 kHz
4
Span
5
,
4
2
5
,
4
.
5
,
4
2
5
,
4
4
5
,
4
k/m
5
RBW: 3 Hz
4
Bw/Avg
5
,
NNNNNNNNNNNNNNNNNNNN
RES BW
,
4
3
5
,
4
x1
5
Reference Level:
0
50 dBm
4
Scale Ref
5
,
NNNNNNNNNNNNNNNNNNNNNNNNNNNNNNNNNNNNNNNNNNNNNNN
REFERENCE VALUE
,
4
-
5
,
4
5
5
,
4
0
5
,
4
x1
5
Input Attenuator R: 0 dB;
4
Scale Ref
5
,
NNNNNNNNNNNNNNNNNNNNNNNNNNNNNNNNNNNNNNNNNNNNNNN
ATTENUATOR MENU
,
NNNNNNNNNNNNNNNNNNNNNNN
ATTEN R
,
4
0
5
,
4
x1
5
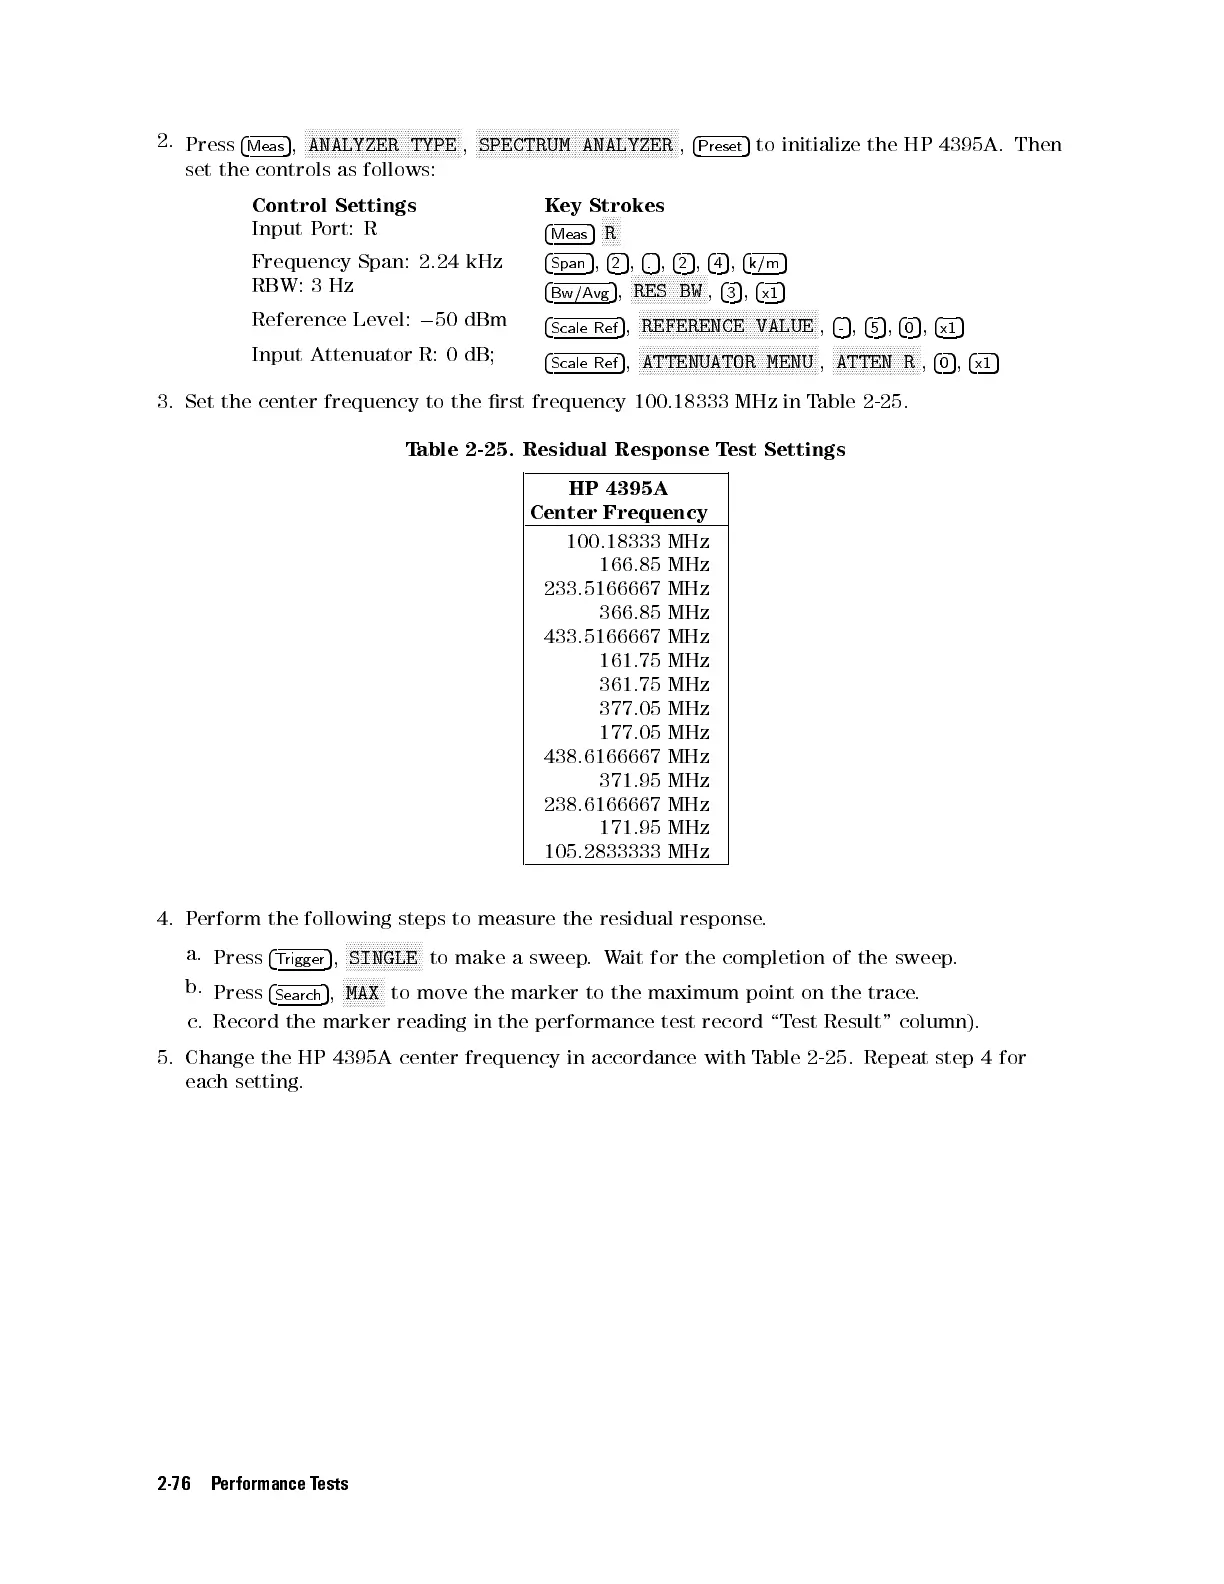
3. Set the center frequency to the rst frequency 100.18333 MHz in Table 2-25 .
Table 2-25. Residual Response Test Settings
HP 4395A
Center Frequency
100.18333 MHz
166.85 MHz
233.5166667 MHz
366.85 MHz
433.5166667 MHz
161.75 MHz
361.75 MHz
377.05 MHz
177.05 MHz
438.6166667 MHz
371.95 MHz
238.6166667 MHz
171.95 MHz
105.2833333 MHz
4. Perform the following steps to measure the residual response.
a.
Press
4
Trigger
5
,
NNNNNNNNNNNNNNNNNNNN
SINGLE
to make a sweep.Wait for the completion of the sweep.
b.
Press
4
Search
5
,
NNNNNNNNNNN
MAX
to move the marker to the maximum point on the trace.
c. Record the marker reading in the performance test record \Test Result" column).
5. Change the HP 4395A center frequency in accordance with Table 2-25 . Repeat step 4 for
each setting.
2-76 Performance Tests
 Loading...