EasyManua.ls Logo

HP 48G Series

HP 48G Series
116 pages
To Next Page IconTo Next Page
To Previous Page IconTo Previous Page
Loading...
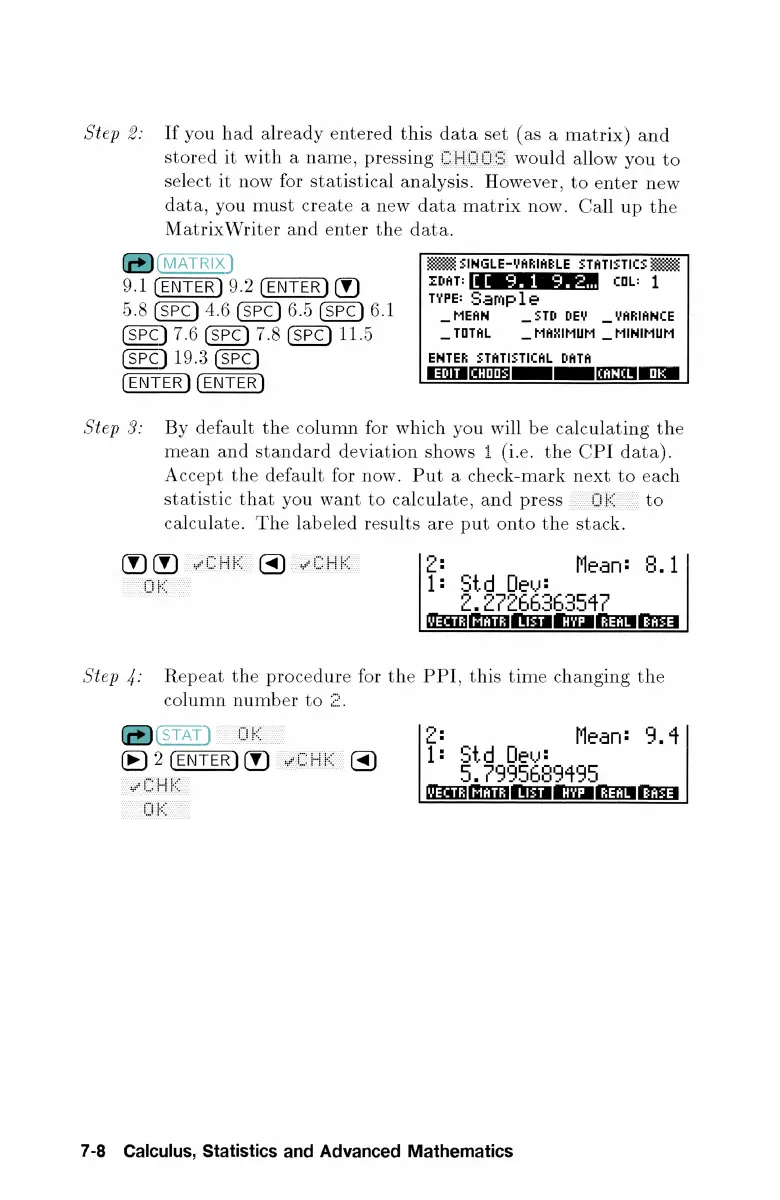
Step
2:
If
you
had
already
entered
this
data
set
(as
a
matrix)
and
stored
it
with
a
name,
pressing
CHIE
would
allow
you
to
select
it
now
for
statistical
analysis.
However,
to
enter
new
data,
you
must
create
a
new
data
matrix
now.
Call
up
the
MatrixWriter
and
enter
the
data.
@)(VATRIX)
HE
SINGLE-VARIAELE
STATISTICS
Bag
9.1
(ENTER)
9.2
(ENTER)
(V)
Tr
EM
col:
2.8
(sPC)
4.6
(SPC)
6.5
(SPC)
6.1
_MEAN
_3TD
DEY
_
VARIANCE
(SPC)
7.6
7.8
11.5
_TOTHL
_MAKIMUM
_
MINIMUM
(SPC)
19.3
(SPQ)
ENTER
STHTISTICHL
DATA
[EOIT
[CHODS]
|
JCANGL]
OK
Step
3:
By
default
the
column
for
which
you
will
be
calculating
the
mean
and
standard
deviation
shows
i
(i.e.
the
CPI
data).
Accept
the
default
for
now.
Put
a
check-mark
next
to
each
statistic
that
you
want
to
calculate,
and
press
{ik
to
calculate.
The
labeled
results
are
put
onto
the
stack.
BD
©
1:
Std
Dey:
=n
2.
2rebbIe3atr
MECTRI
MATE]
LIST
HYP
REAL
EASE
Step
4:
Repeat
the
procedure
for
the
PPI,
this
time
changing
the
column
number
to
=.
CAT)
oo
2
Std
Deu:
Mean:
9.4
®)
2
ENTER)
(1)
wit
(9)
2
5905609495
*
VECTE[
MATE]
LIZT
|
HYP
|
REAL
|
EASE
|
7-8
Calculus,
Statistics
and
Advanced
Mathematics

Other manuals for HP 48G Series

Related product manuals