EasyManuals Logo

HP 48G Series User Manual

HP 48G Series
116 pages
To Next Page IconTo Next Page
To Previous Page IconTo Previous Page
Page #96 background imageLoading...
Page #96 background image
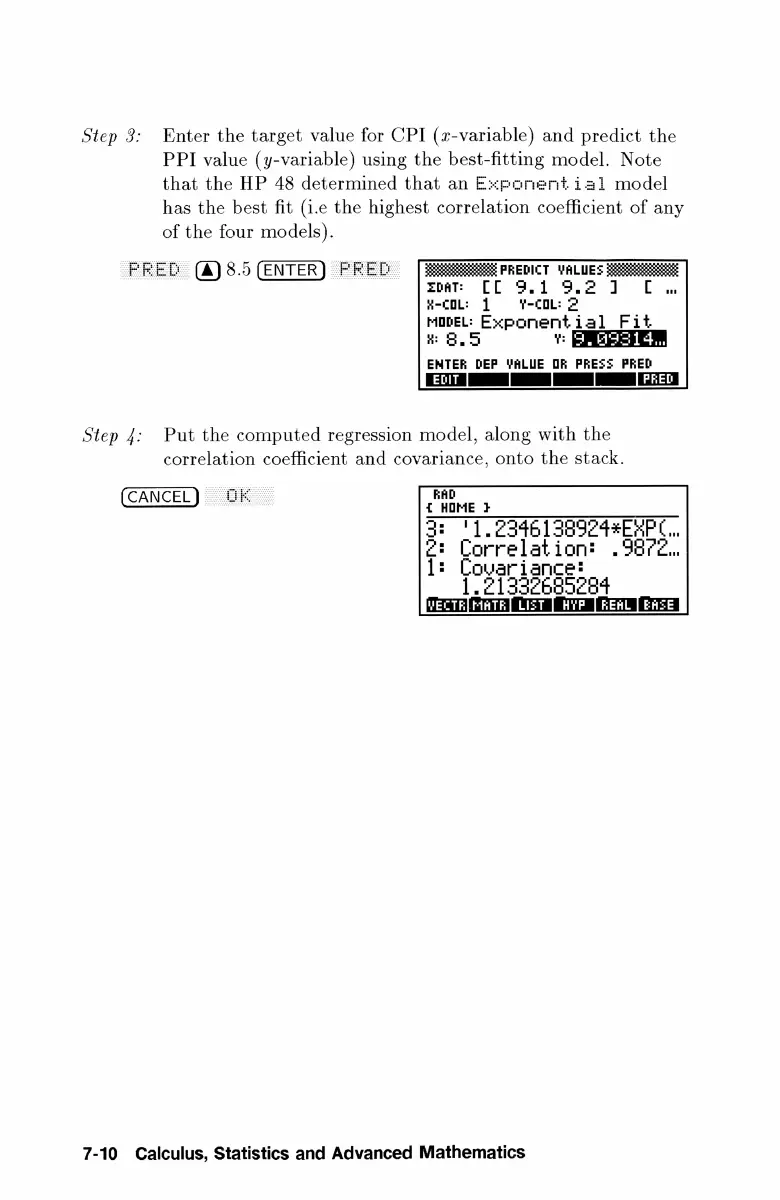
Step
3:
Enter
the
target
value
for
CPI
(z-variable)
and
predict
the
PPI
value
(y-variable)
using
the
best-
fitting
model.
Note
that the
HP
48
determined
that
an
Exponent
ial
model
has
the
best
fit
(i.e
the
highest
correlation
coefficient
of
any
of
the
four
en
a
%
PREDICT
VALUES
358
aT:
[[
9.1
9.2
1]
¥-coL:
1
y-coL:
2
os
Exponent
§
ia
ENTER
DEP
VALUE
OF
PRESS
Si
I
EE
Step
4:
Put
the
computed
regression
model,
along
with
the
correlation
coefficient
and
covariance,
onto
the
stack.
£
HOME
}
3:
'1,2346138924+ERXPL..
2:
Correlation:
.987%.
1:
Covariance:
1.21332685264
MECTR[
MATE]
LIST
HYP
REAL
[EASE
7-10
Calculus,
Statistics
and
Advanced
Mathematics

Other manuals for HP 48G Series

Questions and Answers:

Question and Answer IconNeed help?

Do you have a question about the HP 48G Series and is the answer not in the manual?

HP 48G Series Specifications

General IconGeneral
ModelHP 48G Series
TypeGraphing Calculator
Display TypeLCD
Display Size131x64 pixels
Programming LanguageRPL (Reverse Polish Lisp)
Memory32 KB RAM
ProcessorSaturn
Power Supply3x AAA batteries
ConnectivityInfrared (IR)

Related product manuals