EasyManua.ls Logo

HP SmartCalc 300s

HP SmartCalc 300s
27 pages
To Next Page IconTo Next Page
To Previous Page IconTo Previous Page
Loading...
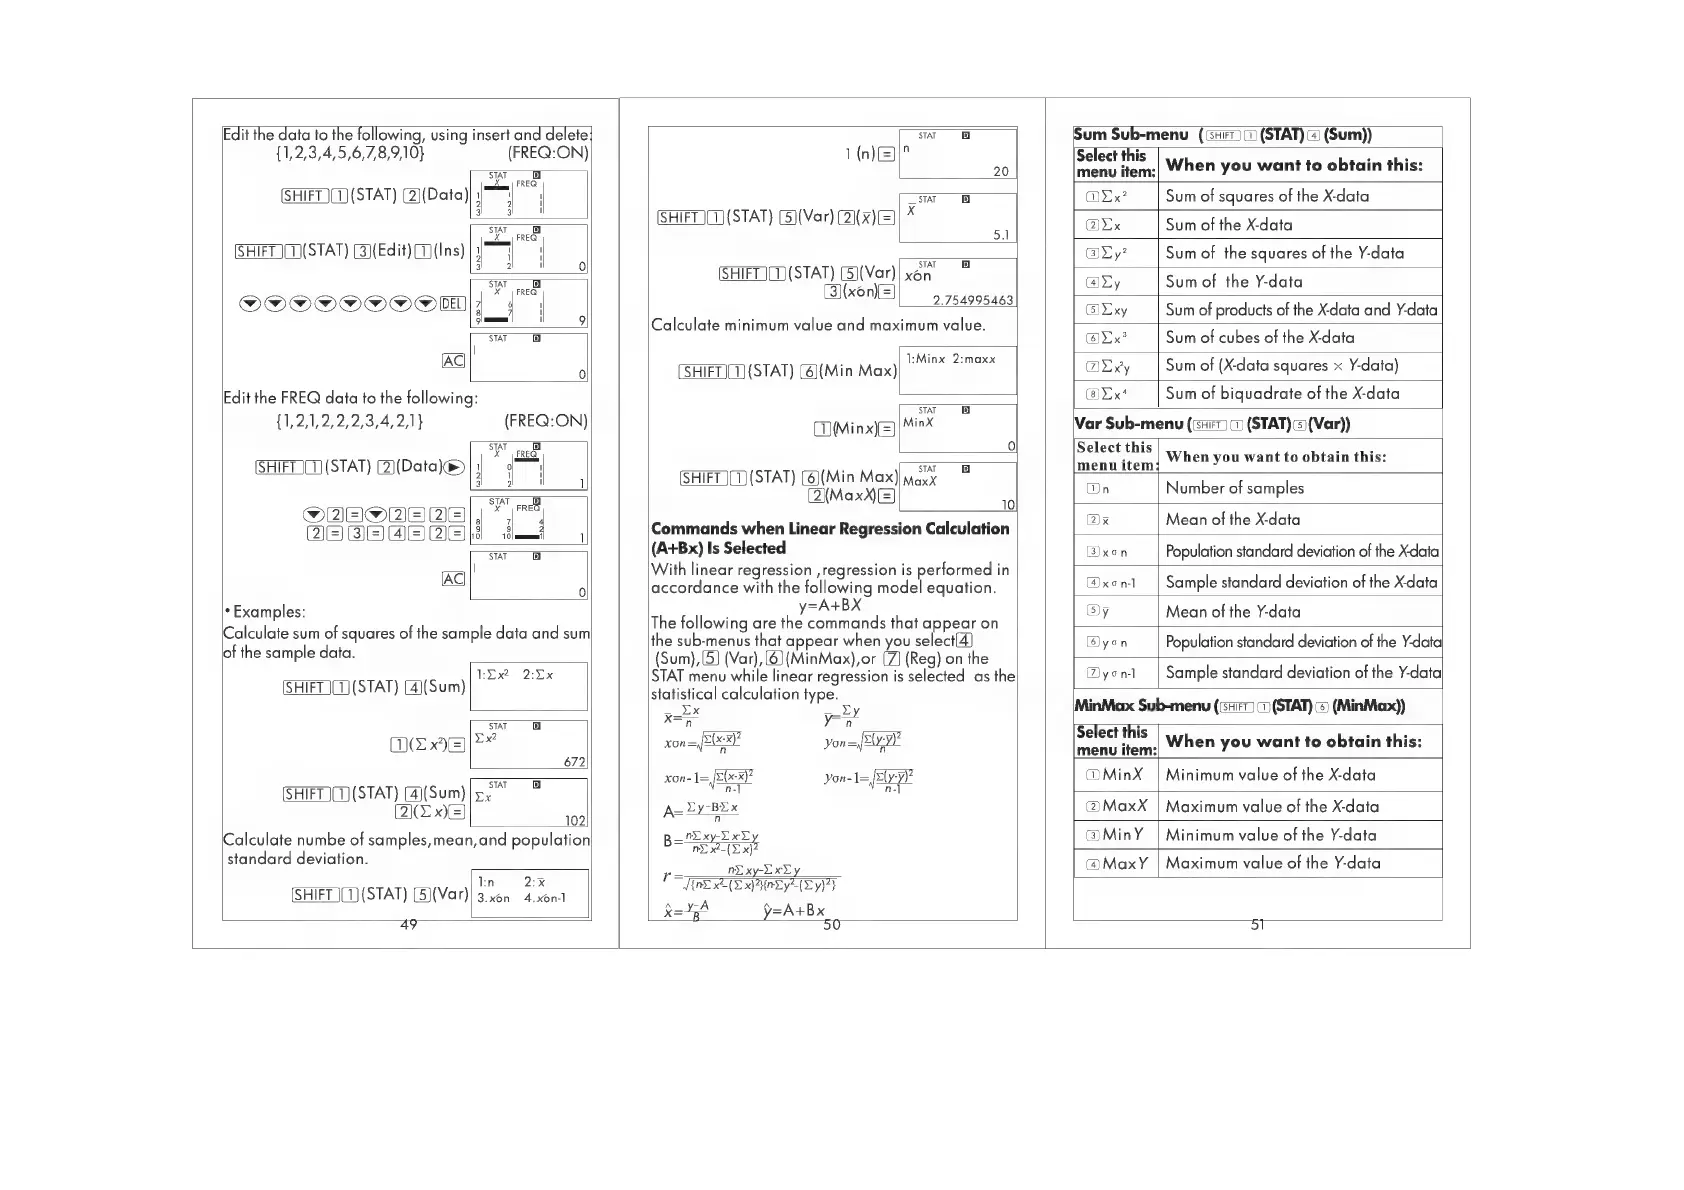
Edit
the
data
to
the
following,
using
insert
and
delete
АТ
m
Sum
Sub-menu
(suc
со
(STAT)
(4)
(Sum))
1,2,3,4,5,6,7,8,9,10
FREQ:ON
ІШЕ
i
—-—
|
к
m
|
mj
20
select
ms.
When
you
want
to
obtain
this:
(SHIFT
СТ)
(STAT)
(2)(Data)
|77
|
“НАТ
ТЫ
Ex?
Sum
of
squares
of
the
X-data
=
=
(SHIFT
/1(5ТАТ)
(5)(Var)
2)
(2)
*
ғау”
Sum
of
the
X-data
X
FREQ
5.
=
(SHIFT
(T(STAT)
(3)(Edit)(T)(Ins)
173.
:
А
mr—s
Ху!
Sum
of
the
squares
of
the
Y-data
3 2
!
2
sw
B
ет
xan
Gy
Sum
of
the
Y-data
MOM
OM
C)
DEL)
2
4
1
E
2.754995463
Ух
S
f
d
|
Уху
um
of
products
of
the
X-data
and
Y-data
=
ШН
9
Calculate
minimum
value
and
maximum
value.
P
"MEL
Xx
Sum
of
cubes
of
the
X-data
o
SHEDO
(STAT)
(6(Міп
Max)
шы
Ху
Sum
of
(X-data
squares
x
Y-data)
Edit
the
FREQ
data
to
the
following:
=
(8)22x*
Sum
of
biquadrate
of
the
X-data
STAT
{1,2,1,2,2,2,3,4,2,1}
(FREQ:ON)
(Minx)
Minx
Var
Sub-menu
(нет
)ст
(STAT)(5)(Var))
трт
oH
БЕ
0
Select
this
|
wy}
UON:
T T
D
t
І
it
en
you
wan
to
obtain
18:
НЕГІ
(8ТАТ)
Оаа
у
у,
SHIFT
JT
(STAT)
(6(Міп
Мах)
м
a
ы
a
(a(MaxX\[=
"
(Un
umber
of
samples
eG)
JG
QJGJ
||.
*
(3x
Е
(3
MAE
8
ur
қ
Commands
when
linear
Regression
Calculation
а
Mean
оне
Хаа
ТШ
(А+Вх)
Is
Selected
(3)xon
Population
standard
deviation
of
the
Xdata
|
With
linear
regression
,regression
is
performed
in
-
"S
0
accordance
with
the
following
model
equation.
Gixeni
|
Sample
standard
deviation
of
the
X-data
*
Examples:
у=А+ВХ
5)у
Mean
of
the
Y-data
The
following
are
the
commands
that
appear
on
носни
um
squares
of
the
sample
data
and
sum
the
sub-menus
that
appear
when
you
select(4]
С
уоп
Population
standard
deviation
of
the
Y-data
of
the
sample
aata.
(Ѕит),
(5)
(Var),
(6)
(MinMax),or
(7)
(Reg)
on
the
©
Бана
dear
Tihe
Ydat
LEX
2:Ex
STAT
menu
while
linear
regression
is
selected
as
the
Dyon-l
ample
standard
deviation
ofthe
T-data
(SHIFT
(1)
(STAT)
[4](Sum)
statistical
calculation
type.
MinMax
Sub-menu
(
(ТАТ)
=
(MinMax))
GEX
—_Ly
|
м
U
((sHiFT
O)
76)
ii
STAT
[с]
Жеп
Уп
+
(х9)
|>
xon
=
=X)
Yon
Ec
y
oe
ne
When
you
want
to
obtain
this:
672
———g
xon-
1
[5(х)2
on-
1
EYY)
піМіпХ
|
Minimum
value
of
the
X-data
ISHIFT
ICDSTAT)
Абит)
as
a
"
т
.МахХ
|
Maxi
lue
of
the
X-dat
BEE
A=
-ВУ
x
2
мах
aximum
value
o
e
A-daia
102
n
Calculate
numbe
of
samples,
mean,
and
population
B-
PEE
@MinY
|
Minimum
value
of
the
Y-data
standard
deviation.
пху
ху
ax
МахҮ
|
Maximum
value
of
the
Y-data
T:n
2:x
А
УУУ]
}
(SHIFT
J(1)
(STAT)
(5)(Var)
3.xon
4.xon-l
УА
А+В
х=
ў=А+Вх
49
XTB
А
50
51

Other manuals for HP SmartCalc 300s

Related product manuals