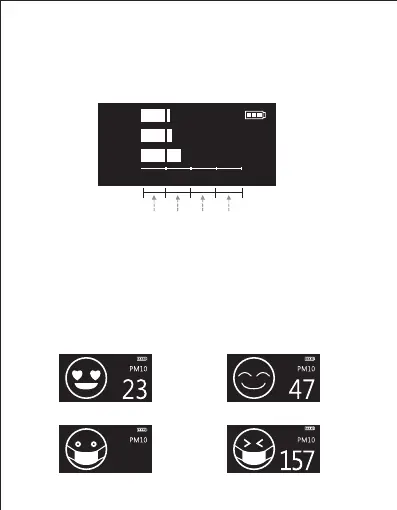
You can easily recognize the good and poor state of find dust
by 4 kinds of icons.
In this mode, it automatically displays the worst between
PM2.5 and PM10.
Red : Unhea
lthy air quality.
PM2.5
PM10
VOC
GOOD
POOR
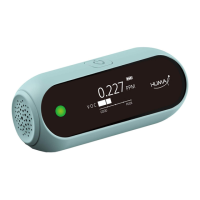
VOC, PM2.5 and PM10 can be viewed in one screen. Graph
with 4 steps shows the air quality - good, moderate, poor
and unhealthy
① Display mode
1) Integrated display mode
It is shown in a step-by-step graph so that air quality can
be judged easier than difficult figures.
Good
Moderate
Poor
Unhealthy
2) WHO mode (Icon mode)
Y
ellow : Poor air quality.
Green : Moderat
e air quality.
Blue : Good air quality.
65