5-
6
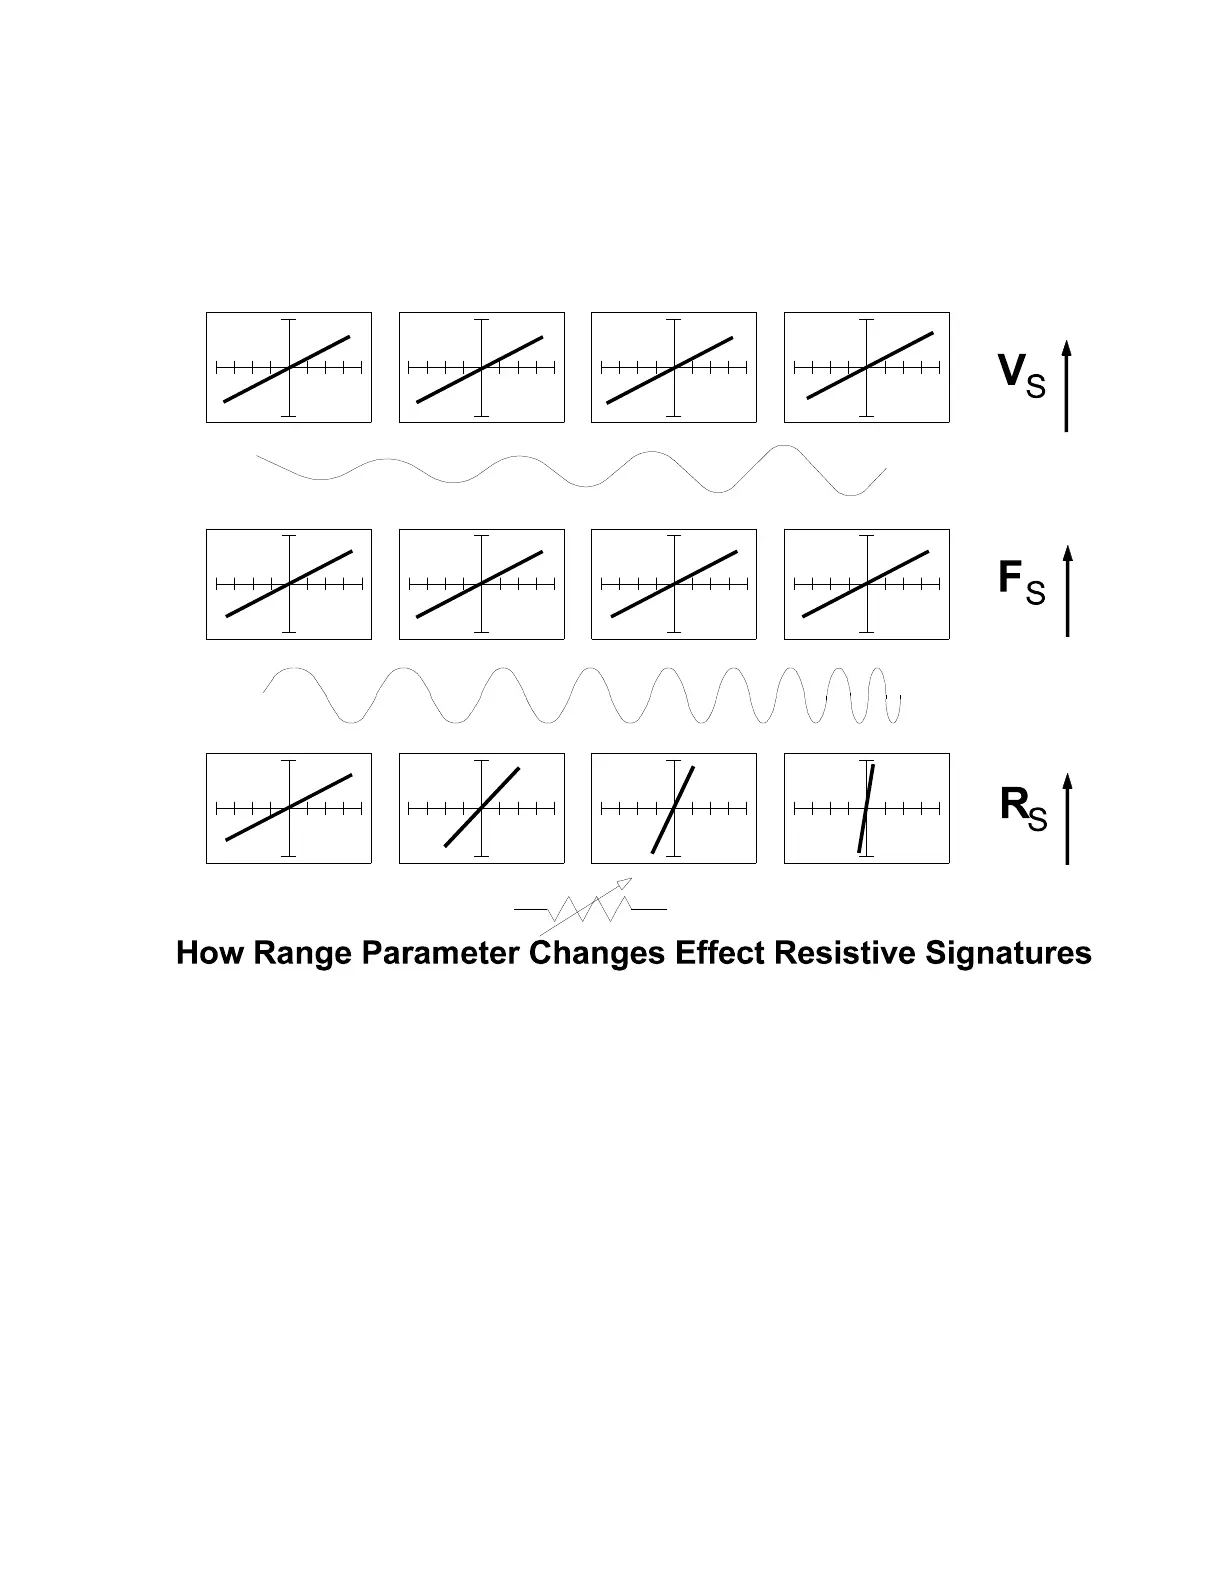
The next figure shows what happens to the LCD display when the different parameters change.
The parameter values increase from left to right displaying source voltage (V
s
), source frequency
(F
s
), and source resistance (R
s
).
A pure resistance across the test terminals will cause the trace on the Tracker 2700 LCD to rotate
in a counter clockwise direction around its center axis from horizontal open circuit position (high
value resistance) to a vertical short circuit (low value resistance). The degree of rotation is a
function of the resistance value.
Figure 5-8. Range Parameters Changes and Effects on Resistive Signatures