5-
21
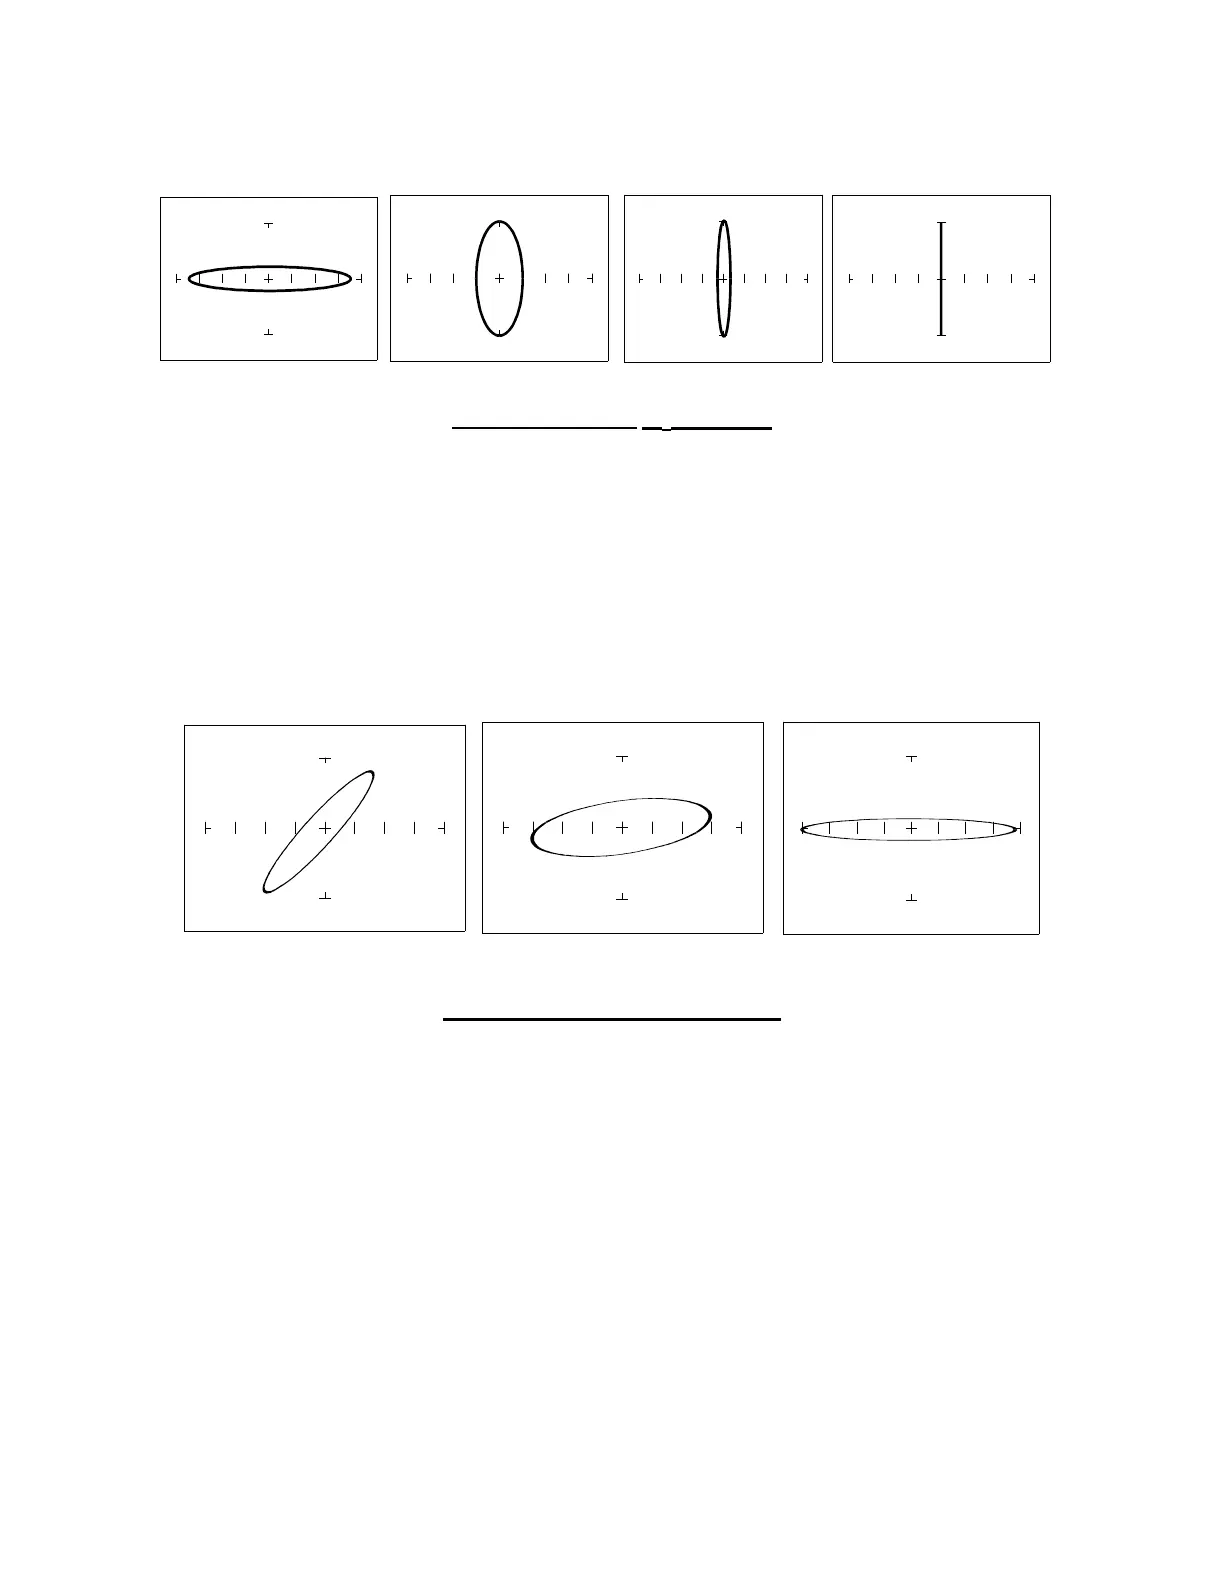
The figure below shows Tracker signatures for four different value inductors, 12,000µH, 1200µH,
120µH and 12µH in the 10V, 100Ω Range.
12000 µH 1200 µH 120 µH 12 µH
10V, 100 Ω
ΩΩ
Ω Range
F
S
= 2000Hz
Figure 5-24. Signatures of 4 Inductors
Note that as the inductance values decrease, each signature changes from a horizontal elliptical
pattern to a vertical elliptical pattern. In TSA, a large value inductor has a signature that looks
similar to an open circuit. And likewise, a small value inductor has a signature that's similar to a
short circuit.
Effect of Frequency F
s
on Inductor Signatures
F
S
= 60 Hz. F
S
= 200 Hz. Fs=2000Hz.
10V, 100 Ω
ΩΩ
Ω Range, L = 12,000 µH
Figure 5-25. Effect of Varying F
S
on Inductor Signatures
Note that the signature changes from a vertical position to a horizontal position as the frequency
increases. This means the resistance of an inductor increases as frequency increases.
 Loading...