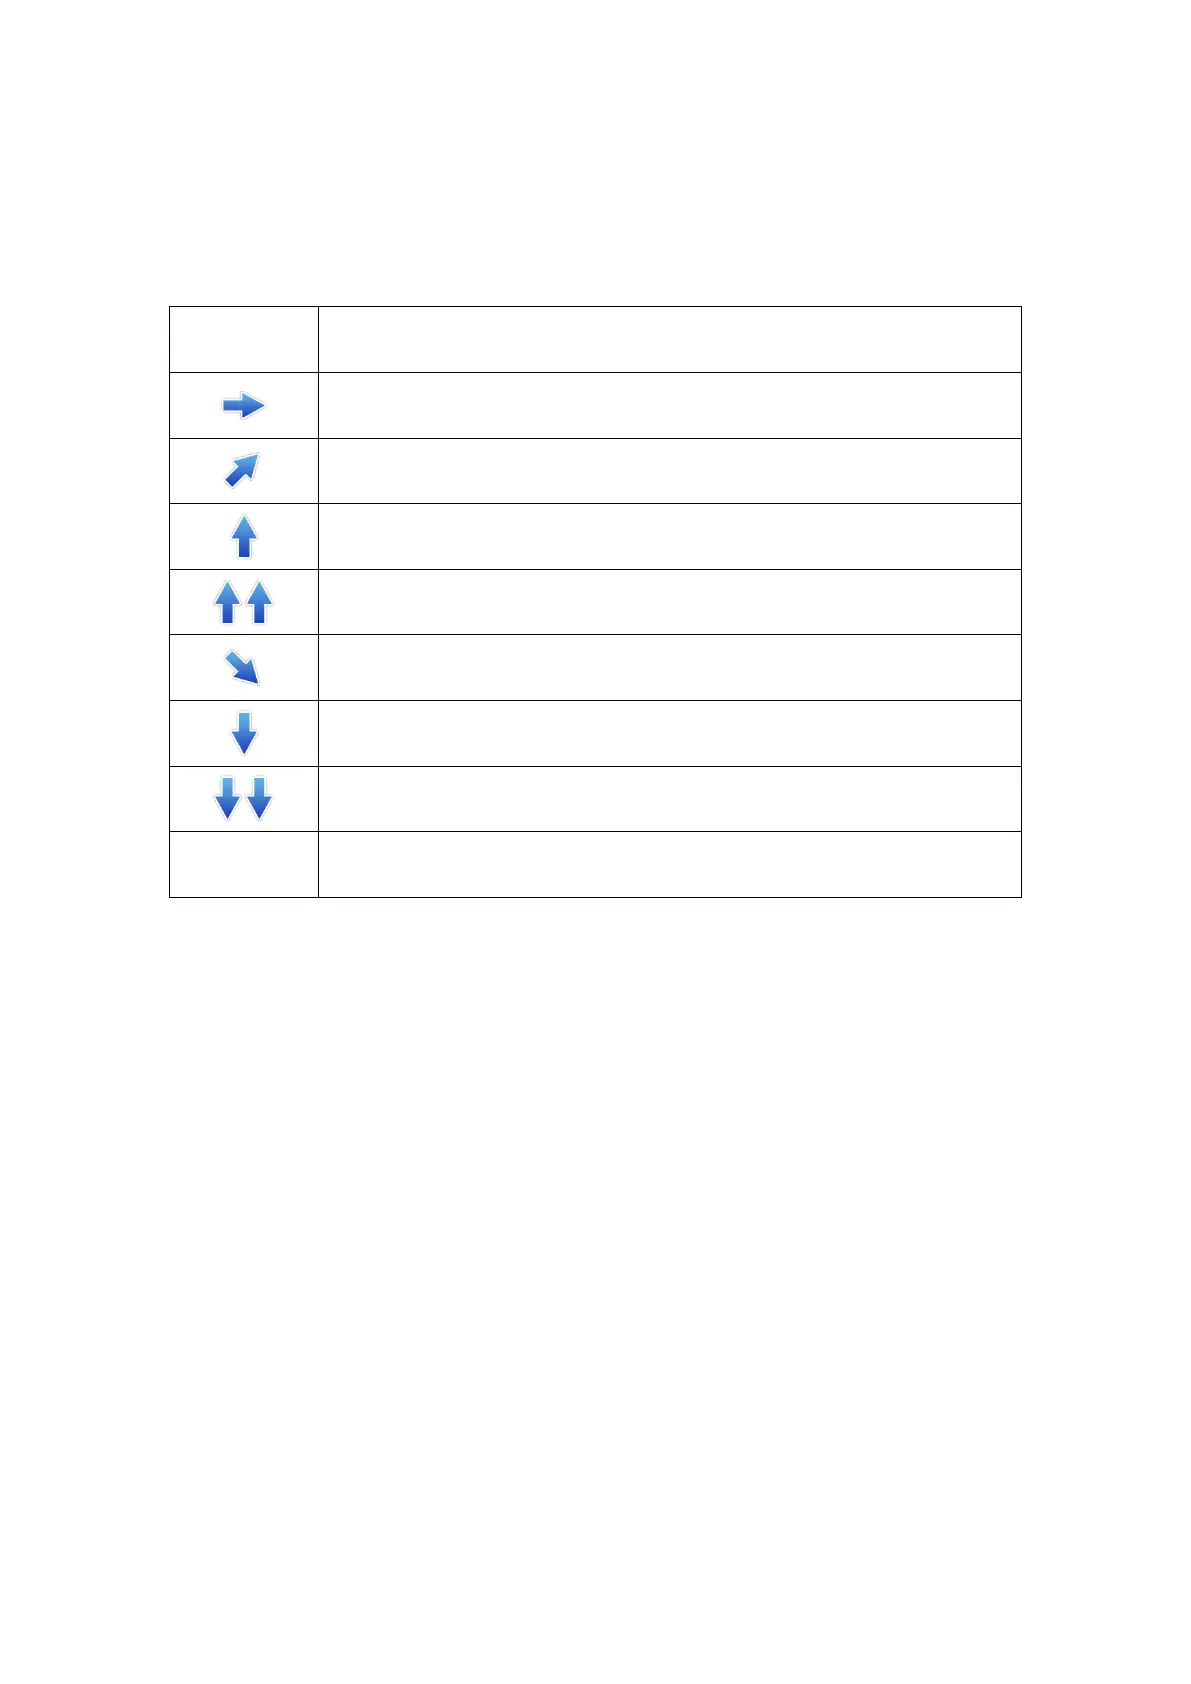
Stable: Blood glucose is stable (no more than 0.06 mmol/L (1.08
mg/dL) rise or fall per minute).
Slow increase: blood glucose increases by 0.06 to 0.11 mmol/L (1.08-
1.98 mg/dL) per minute.
Increase: blood glucose increased by 0.11-0.17 mmol/L (1.98 mg/dL -
3.06mg/dL) per minute.
Rapid increase: blood glucose increased by more than 0.17 mmol/L
(3.06 mg/dL) per minute.
Slow decrease: blood glucose decreased by 0.06 to 0.11 mmol/L
(1.08- 1.98 mg/dL) per minute.
Decrease: blood glucose decreased by 0.11-0.17 mmol/L (1.98 mg/dL -
3.06mg/dL) per minute.
Rapid decrease: blood glucose decreased by more than 0.17 mmol/L
(3.06 mg/dL) per minute.
App cannot, for the moment, calculate the rate of increase or decrease
in blood glucose (data synchronization or disconnection).
5.1.2 Glucose Curve
Glucose curve shows: sensor glucose readings and trends.
Swiping from left to right on the glucose curve, you can review the recent sensor
glucose readings. Sensor glucose reading shows between 2.2-22.2mmol/L (40mg/dL -
400mg/dL). During Sensor Glucose below 2.2mmol/L or above 22.2mmol/L, there
will not be recorded in glucose curve, but sensor glucose readings are still recorded
once every 3 minutes in Logbook.
At the top of the glucose curve, you can tap on the trend view you want to see glucose
levels of the last 4-, 8-, 12-, or 24-hours.